What is AWS Cloudwatch?
As per AWS “Amazon CloudWatch is a monitoring and observability service built for DevOps engineers, developers, site reliability engineers (SREs), and IT managers.” CloudWatch provides you with data and actionable insights to monitor your applications, respond to system-wide performance changes, optimize resource utilization, and get a unified view of operational health. CloudWatch collects monitoring and operational data in the form of logs, metrics, and events, providing you with a unified view of AWS resources, applications, and services that run on AWS and on-premises servers. You can use CloudWatch to detect anomalous behaviour in your environments, set alarms, visualize logs and metrics side by side, take automated actions, troubleshoot issues, and discover insights to keep your applications running smoothly.
Let get started
For in detail blog to view custom instance metrics of an instance in AWS CloudWatch follow the link.
Step 1
Launch an instance
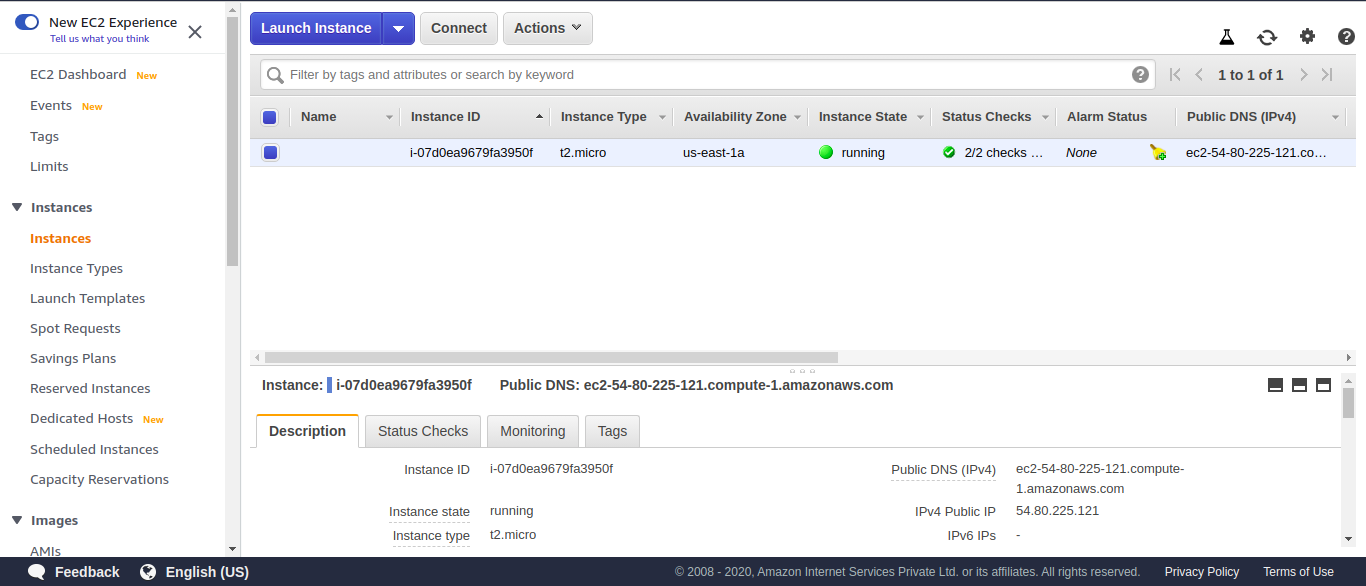
Step 2
Click on services and Select Cloudwatch
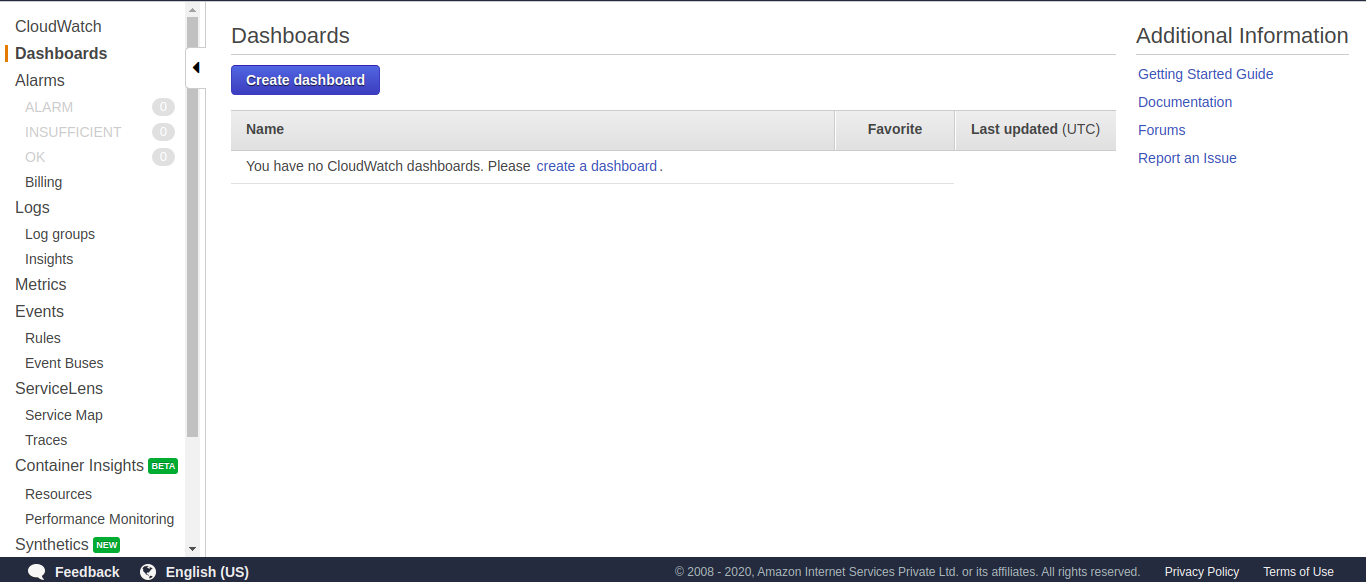
Step 3
Create a new Dashboard
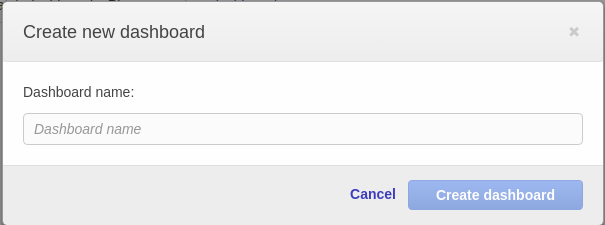
Step 4
Select a widget type to configure
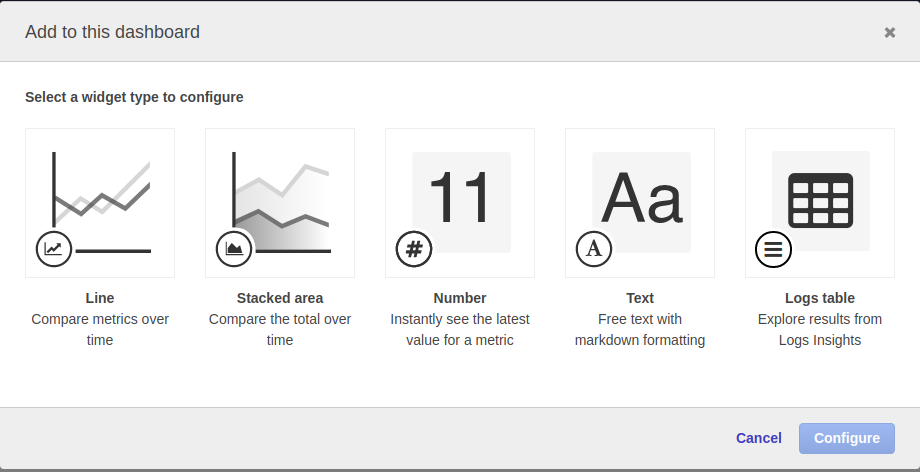
Step 5
Select EC2 in the matric
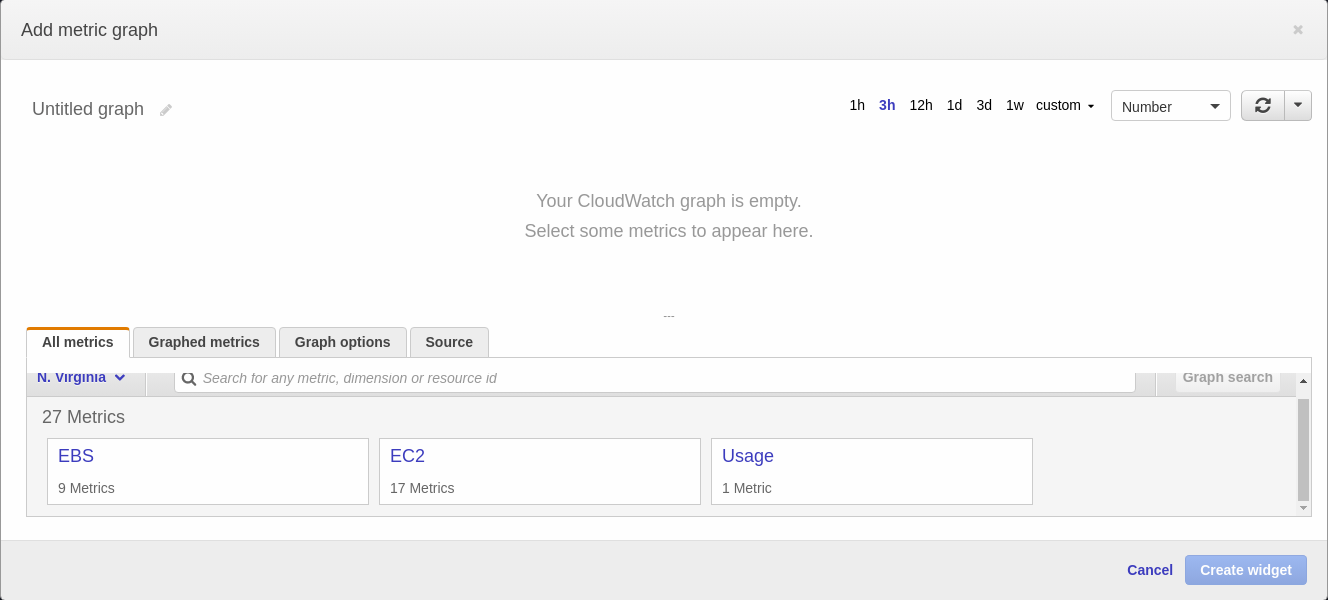
Step 6
Select Pre-instance in the matric
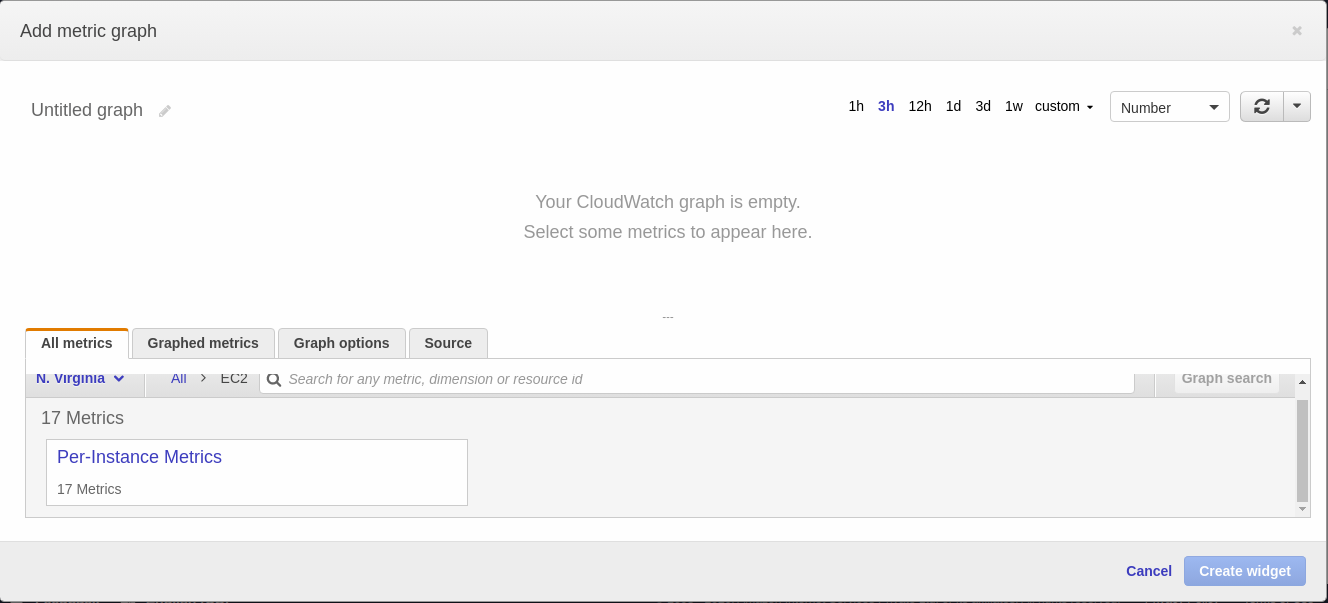
Step 7
Click on CPUUtilization
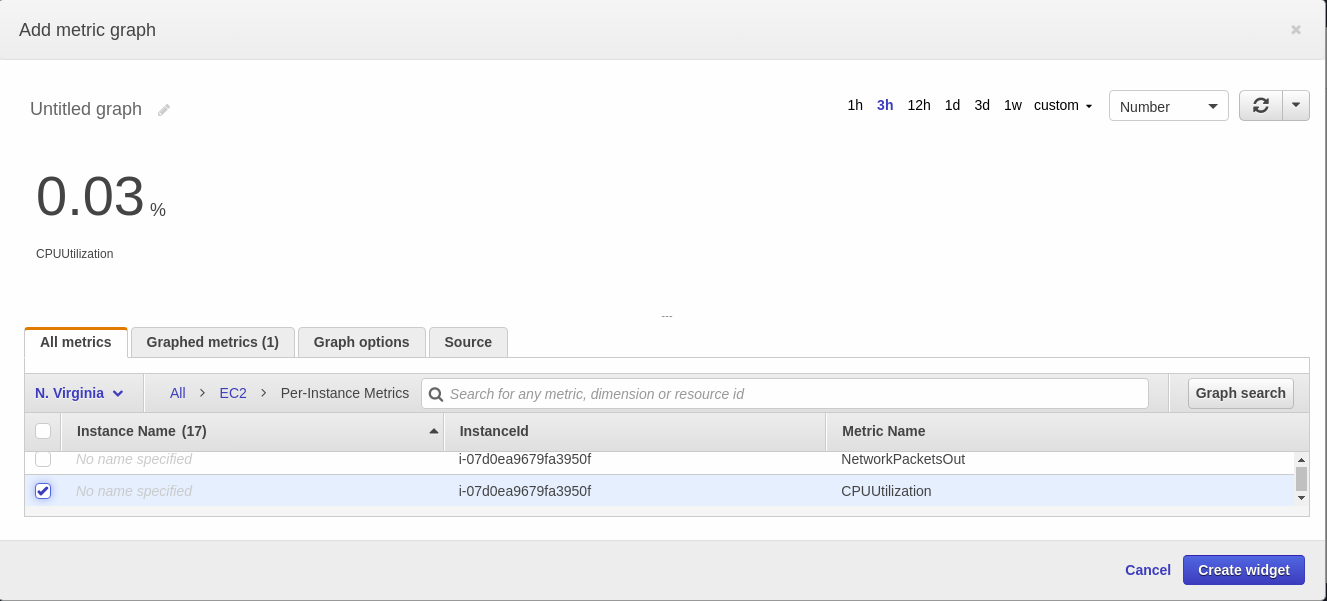
Step 8
Login to the server and install apache2
$ sudo apt install apache2 -y

Step 9
Check the status that apache2 is active or not
$ sudo service apache2 status
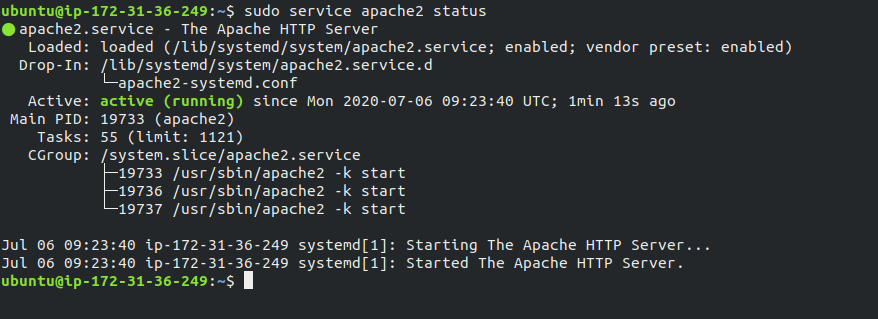
Step 10
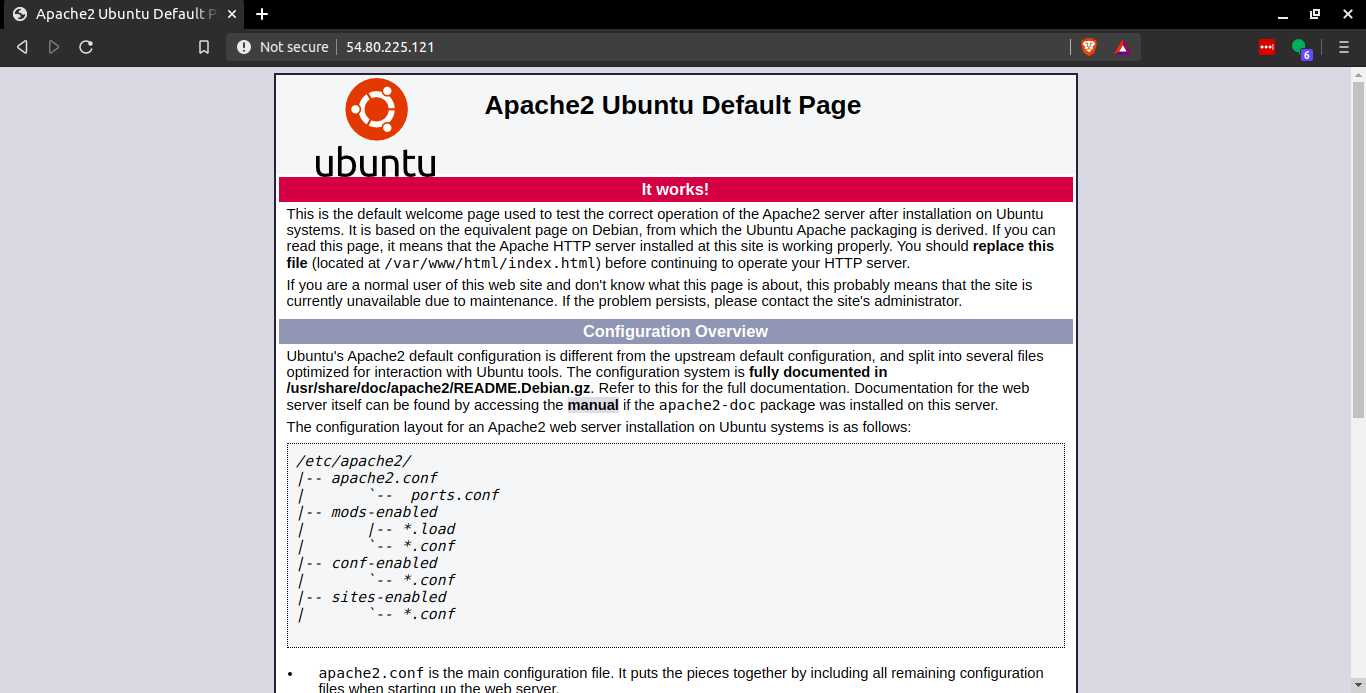
Go to server’s public IP address or domain attached to the server and there should be apache2 default page as soon in the.
Cloudwatch Agent Installation
Step 11
Wget the cloudwatch agent setup with the help of the code below.
$ wget https://s3.amazonaws.com/amazoncloudwatch-agent/ubuntu/amd64/latest/amazon-cloudwatch-agent.deb

Output

Step 12
Now install the downloaded setup with the help of the code below.
$ sudo dpkg -i amazon-cloudwatch-agent.deb

Step 13
- Now create an IAM role to connect the EC2 with Cloudwatch
- The role should have the permission of “CloudWatchAgentServerPolicy ”
- Attach the role to the running server


Step 14
- Start the configuration of the agent with the following command.
- For detail how to configure custom metrics and best configuration please follow the link
$ sudo /opt/aws/amazon-cloudwatch-agent/bin/amazon-cloudwatch-agent-config-wizard

Step 15
Once the configuration is finished we will start the cloudwatch agent with the following command.
$ sudo /opt/aws/amazon-cloudwatch-agent/bin/amazon-cloudwatch-agent-ctl -a fetch-config -m ec2 -c file:/opt/aws/amazon-cloudwatch-agent/bin/config.json -s

Step 16
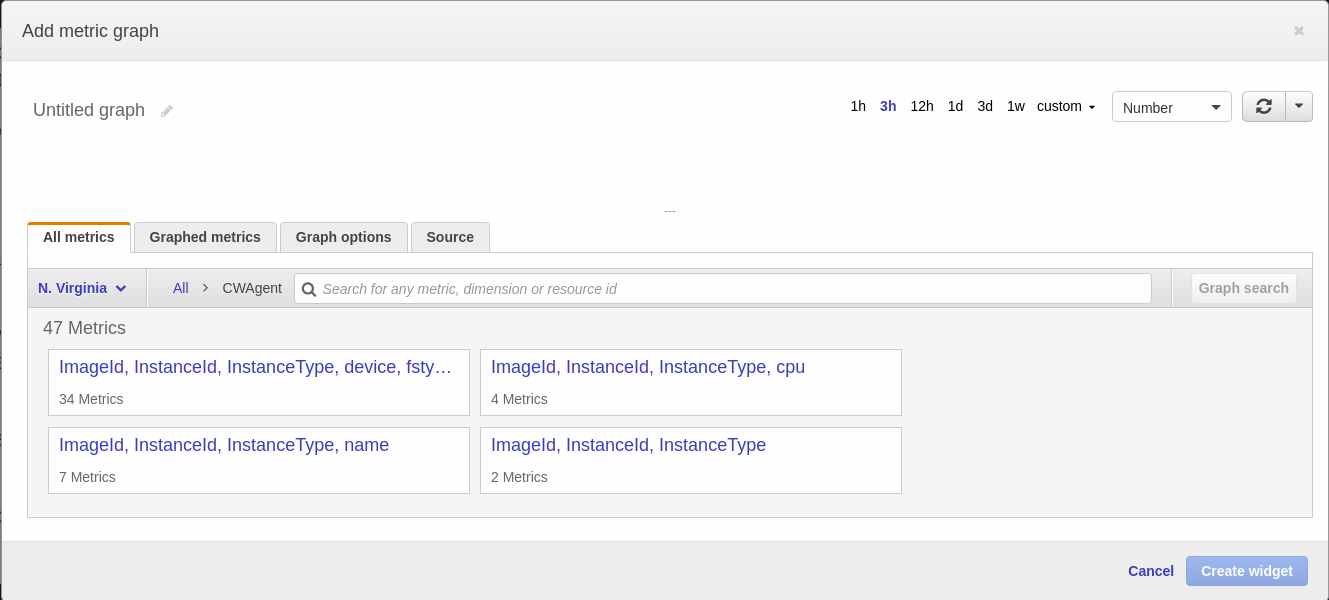
- Now go to CloudWatch dashboard and click on “Add Widget”.
- You will see CWAgent a new matric is been added in the dialog box

Step 17
- Click on CWAgent
- Different type of metrics will be shown. Select the metric that you desire.
Step 18
Click on Create Widget
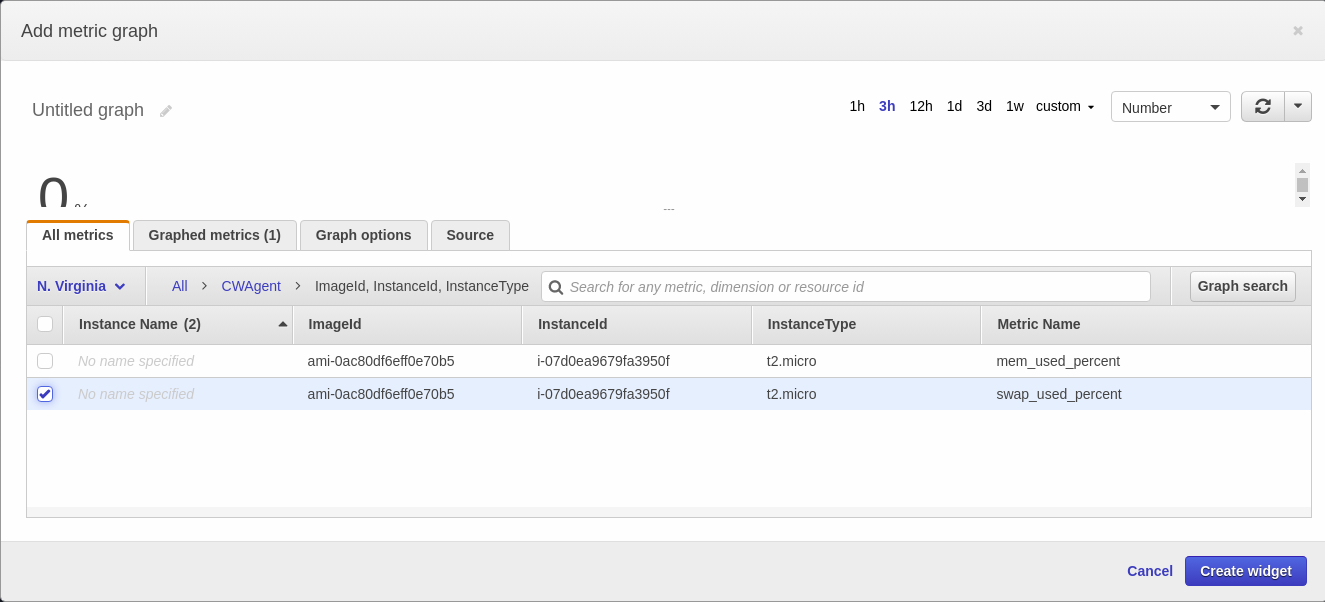
Creating a Widget to show the Apache2 status
Step 19
- Login to the server
- Create a new folder with the following command
$ sudo mkdir /bashcripts

Step 20
Navigate to the folder
$ cd /bashcripts

We are going to manage the widget with the help of scripts so to create and run the script steps are as follows.
Step 21
Create 3 files instance-id instance-id.sh apache-monitor.sh with the help of the following command.
$ touch instance-id instance-id.sh apache-monitor.sh

Step 22
Make the created file .sh executable with the following command.
$ chmod a+x *.sh

Step 23
Edit the create file instance-id.sh with the help of vim.
$ sudo vim instance-id.sh

Step 24
Copy the code from below and paste the code as it is.
#!/bin/bash
curl http://169.254.169.254/latest/meta-data/instance-id

This code will curl the instance id of the server from the metadata.
Step 25
- An instance id is a unique number assigned to the server so to get the instance id of the server which is running the script, we will add the script to cron and will run the script curl to the instance id and will paste the instance in the file created “instance-id” which will be used by apache2 status script.
- So to do this run the following command.
$ sudo crontab -e

Step 26
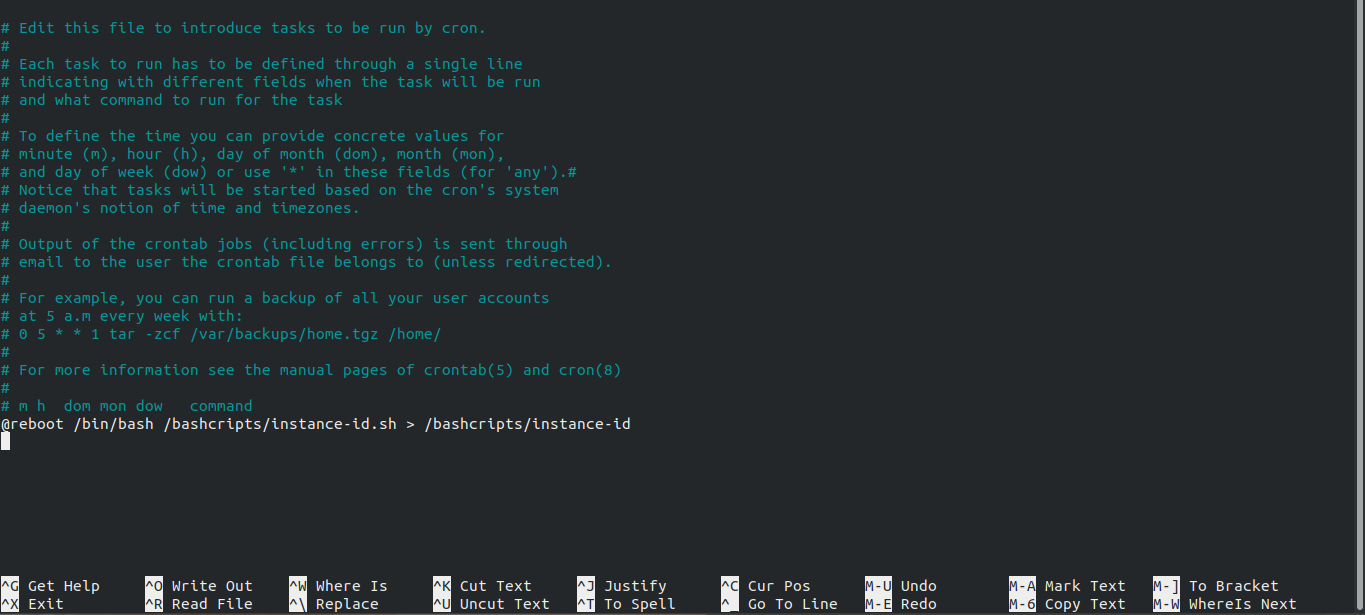
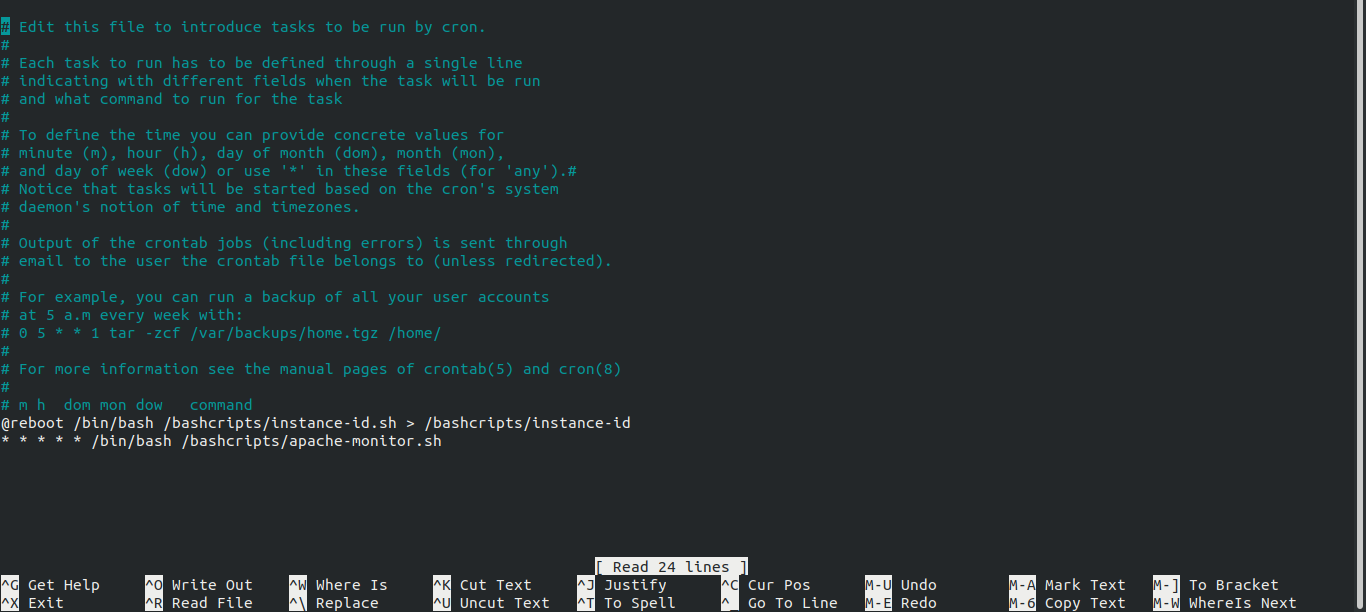
- We need to run this script every time the server reboots.
- So add the following line at the end of the crontab.
@reboot /bin/bash /bashcripts/instance-id.sh > /bashcripts/instance-id
Step 27
Now edit the apache-monitor.sh to get the status of whether the apache2 service is running or not.
$ sudo vim apache-monitor.sh

Step 28
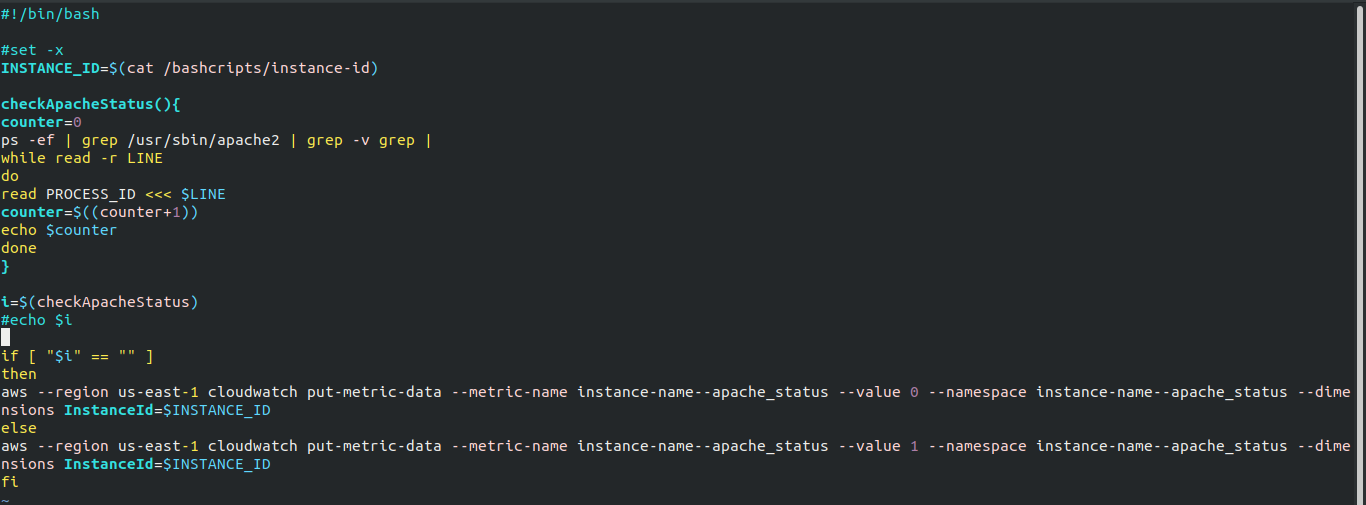
Paste the script as it is in the apache-monitor.sh then replace , in the script according to your configuration
#!/bin/bash
#set -x
INSTANCE_ID=$(cat /bashcripts/instance-id)


checkApacheStatus(){
counter=0
ps -ef | grep /usr/sbin/apache2 | grep -v grep |
while read -r LINE
do
read PROCESS_ID <<< $LINE
counter=$((counter+1))
echo $counter
done
}


i=$(checkApacheStatus)
#echo $i


if [ "$i" == "" ]
then
aws --region  cloudwatch put-metric-data --metric-name --apache_status --value 0 --namespace --apache_status --dimensions InstanceId=$INSTANCE_ID
else
aws --region  cloudwatch put-metric-data --metric-name --apache_status --value 1 --namespace --apache_status --dimensions InstanceId=$INSTANCE_ID
fi
Step 29
We need to run this script in every one minute to check whether the apache2 service is running or not. To do this we are going to run this script via cron.
$ sudo crontab -e

Step 30
Paste the command at the end of the command
* * * * * /bin/bash /bashcripts/apache-monitor.sh
Step 31
Install AWS CLI
$ sudo apt install awscli -y

Step 32
- Restart the server
- When the server is restarted
- Go to /bashcripts
- $ cd /bashcripts
- View the instance id file and check if the instance id is there or not
- $ cat instance-id

How to create CloudWatch ALarm if the apache2 service status fails
Step 33
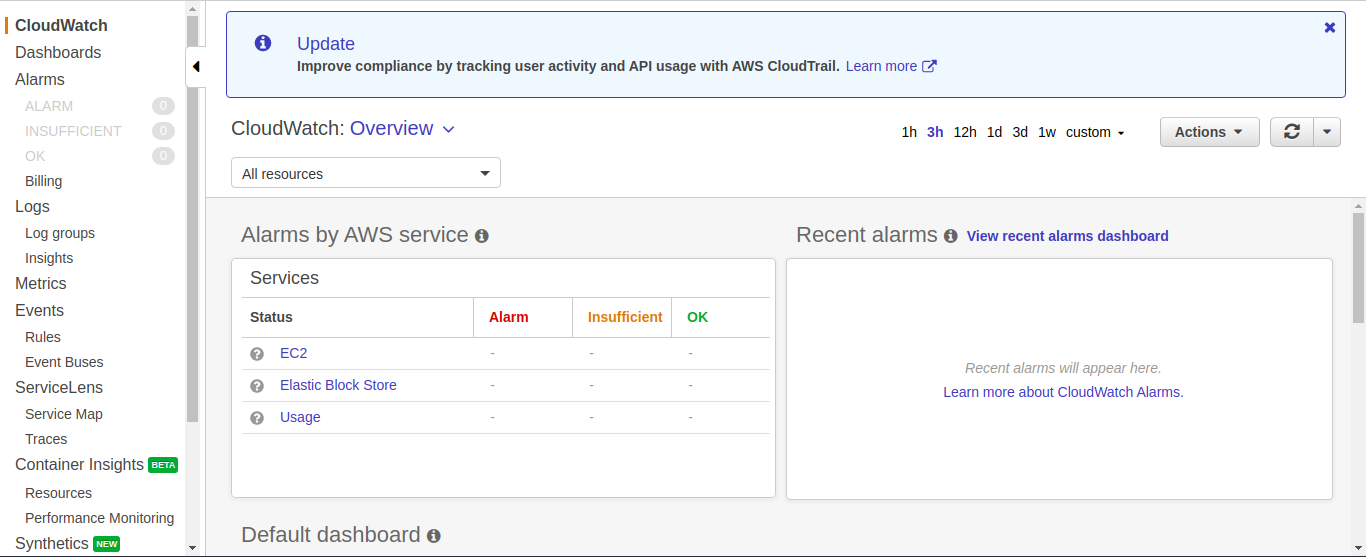
Go to Cloudwatch
Step 34
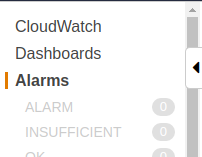
Click on Alarm
Step 35
Click on Create Alarm

Step 36
Click on Select Metric

Step 37
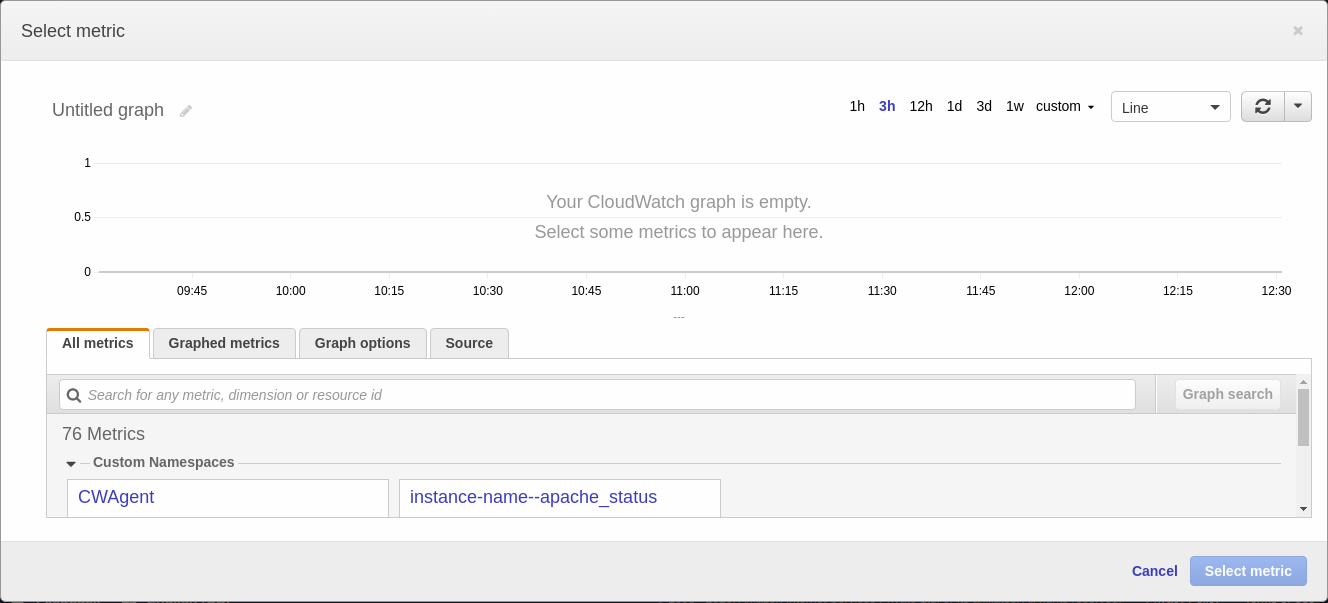
Select -apache-status
Step 38
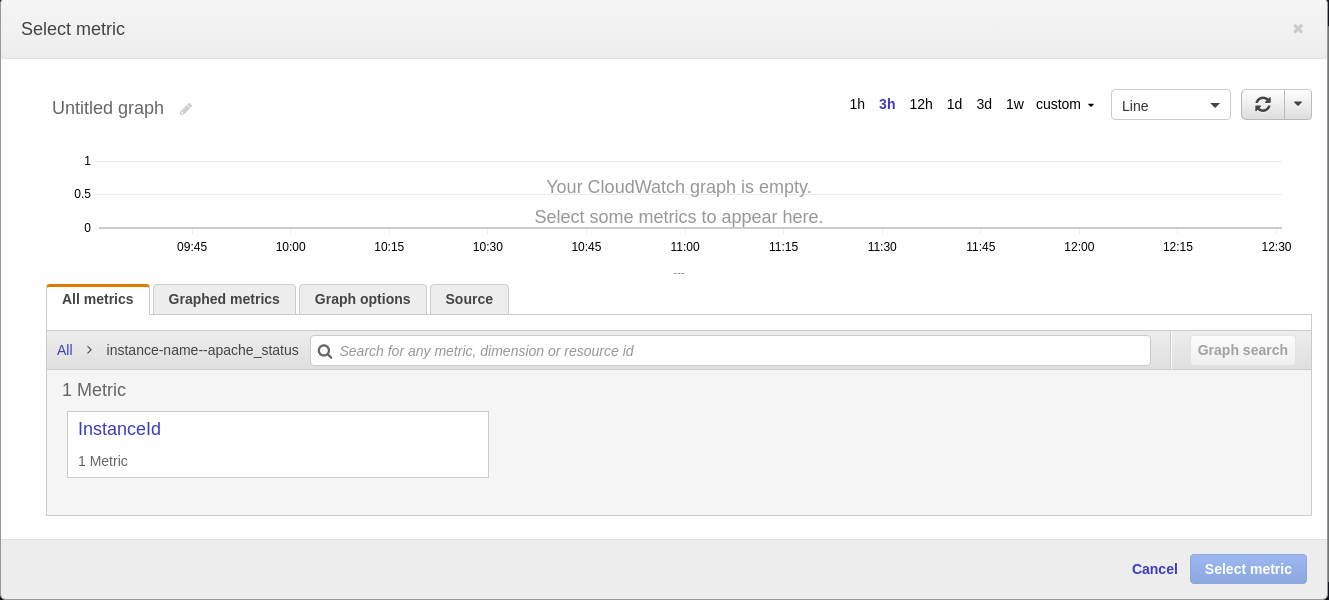
Click on the Instance ID
Step 39
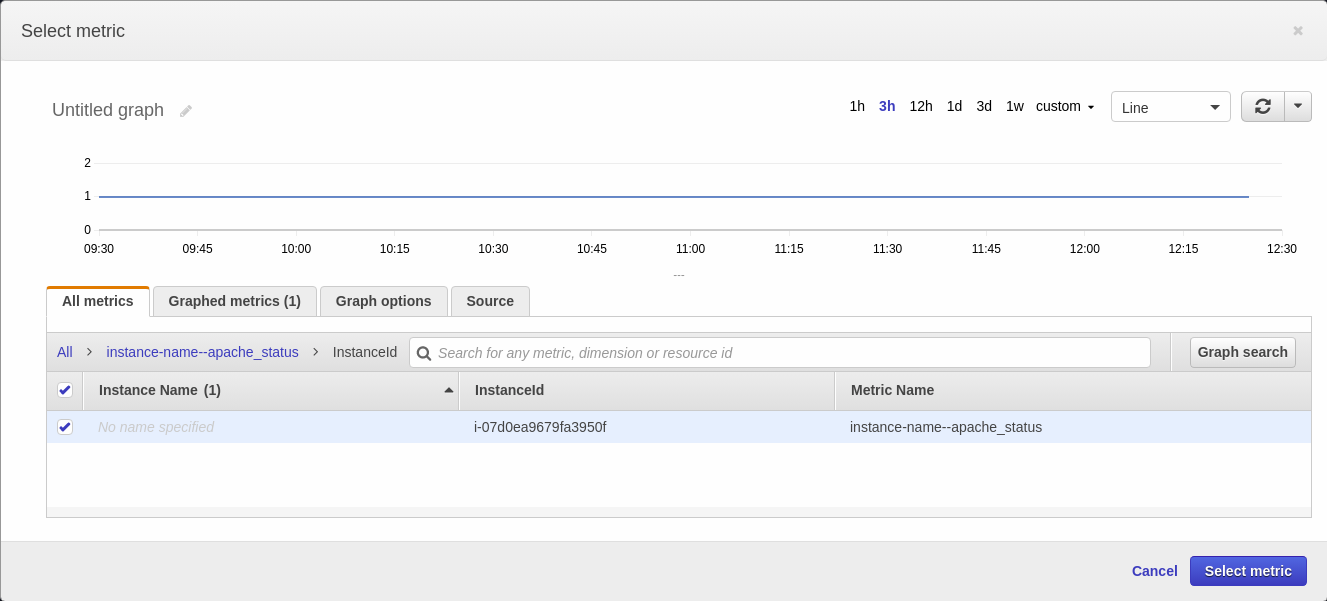
- Select the matric
- Click on select metric
Step 40
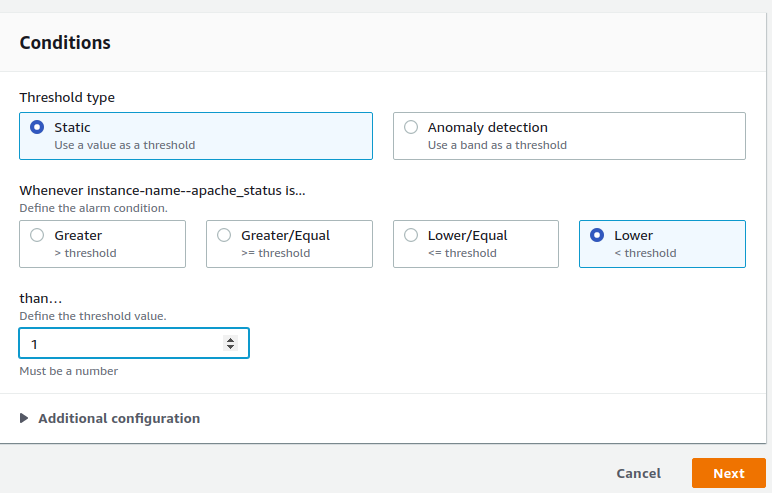
Apply the condition if it is lower than 1 then the alarm should trigger
Step 41
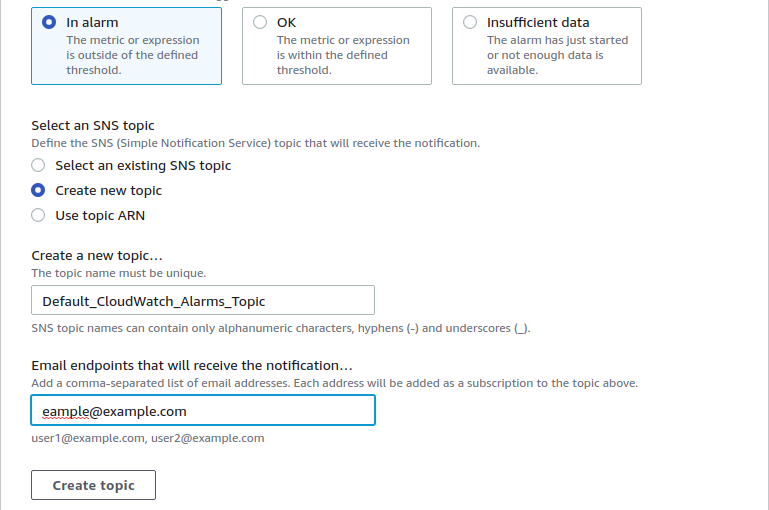
Give the endpoint if you have SNS topic than select that if not then click on create new SNS topic as you can follow the steps below.
Step 42
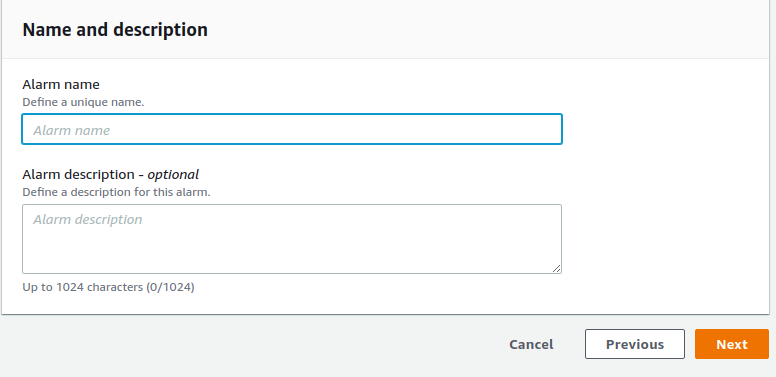
Input the name and description
Step 43
Click on Create Alarm
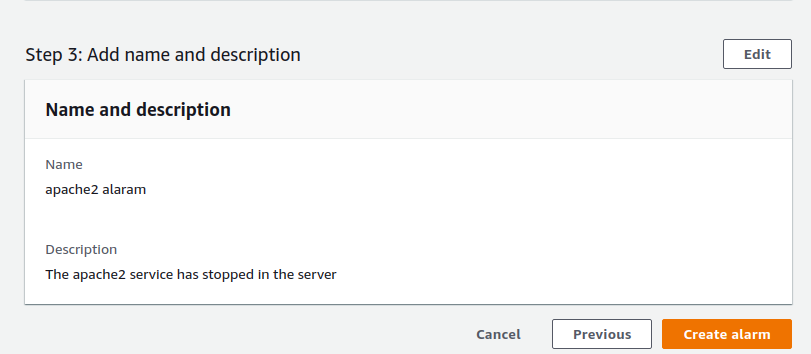
The Alarm will be created and will trigger if the ApacheM service fails.


Leave a Reply