Description
When it comes to running and operating production-grade EKS managed Kubernetes clusters, monitoring and alerting are considered essential components of an enterprise Kubernetes observability stack.
You’ll learn how to integrate these monitoring applications together into an effective and cohesive monitoring solution.
Learning Objectives
Upon completion of this Lab, you will be able to:
- Deploy and instrument a sample Python Flask web-based API into Kubernetes, instrumented to provide metrics which will be collected by Prometheus and displayed within Grafana
- Install and configure Prometheus into Kubernetes using Helm
- Setup Prometheus for service discovery
- Install and configure Grafana into Kubernetes using Helm
- Import pre-built Grafana dashboards for real-time visualisations
Logging In to the Amazon Web Services Console
Introduction
This lab experience involves Amazon Web Services (AWS), and you will use the AWS Management Console to complete the instructions in the following lab steps.
The AWS Management Console is a web control panel for managing all your AWS resources, from EC2 instances to SNS topics. The console enables cloud management for all aspects of the AWS account, including managing security credentials and even setting up new IAM Users.
4
Installing Kubernetes Management Tools and Utilities
0/1
0 out of 1 validations checks passed
Introduction
In preparation to manage your EKS Kubernetes cluster, you will need to install several Kubernetes management-related tools and utilities. In this lab step, you will install:
- kubectl: the Kubernetes command-line utility which is used for communicating with the Kubernetes Cluster API server
- awscli: used to query and retrieve your Amazon EKS cluster connection details, written into the
~/.kube/configfile
Instructions
1. Download the kubectl utility, give it executable permissions, and copy it into a directory that is part of the PATH environment variable:
1curl -O https://s3.us-west-2.amazonaws.com/amazon-eks/1.31.0/2024-09-12/bin/linux/amd64/kubectl2chmod +x ./kubectl3sudo cp ./kubectl /usr/local/bin4export PATH=/usr/local/bin:$PATH

2. Test the kubectl utility, ensuring that it can be called like so:
1kubectl version --client=true
You will see the version of the kubectl utility displayed.
3. Download the AWS CLI utility, give it executable permissions, and copy it into a directory that is part of the PATH environment variable:
1curl "https://awscli.amazonaws.com/awscli-exe-linux-x86_64.zip" -o "awscliv2.zip"2unzip awscliv2.zip3sudo ./aws/install

4. Test the aws utility, ensuring that it can be called like so:
1aws --version

5. Use the aws utility, to retrieve EKS Cluster name:
1EKS_CLUSTER_NAME=$(aws eks list-clusters --region us-west-2 --query clusters[0] --output text)2echo $EKS_CLUSTER_NAME

6. Use the aws utility to query and retrieve your Amazon EKS cluster connection details, saving them into the ~/.kube/config file. Enter the following command in the terminal:
1aws eks update-kubeconfig --name $EKS_CLUSTER_NAME --region us-west-2

7. View the EKS Cluster connection details. This confirms that the EKS authentication credentials required to authenticate have been correctly copied into the ~/.kube/config file. Enter the following command in the terminal:
1cat ~/.kube/config
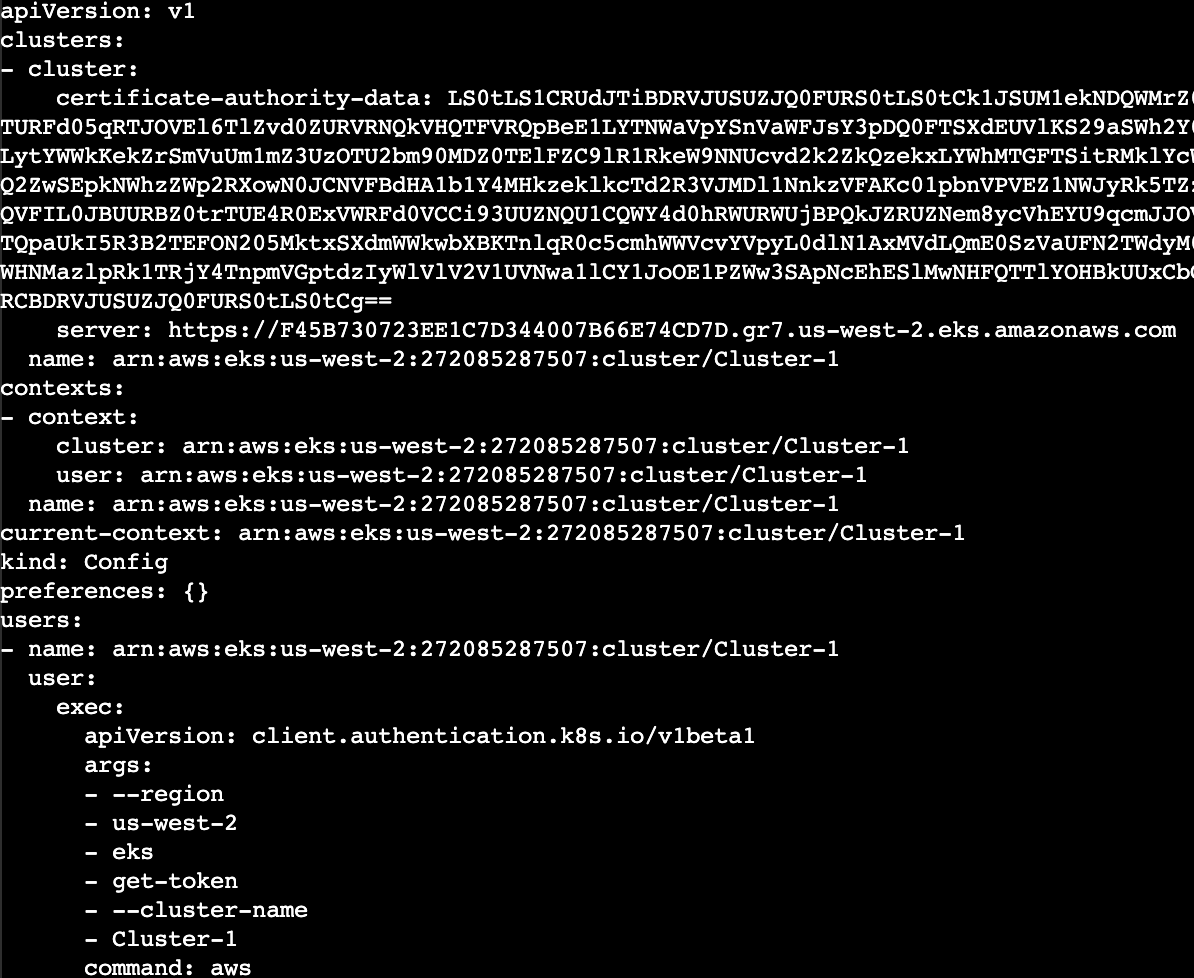
8. Use the kubectl utility to list the EKS Cluster Worker Nodes:
1kubectl get nodes

Note: If you see the following error, authorization to the cluster is still propagating to your instance role:

Ensure the cluster’s node group is ready and reissue the command periodically.
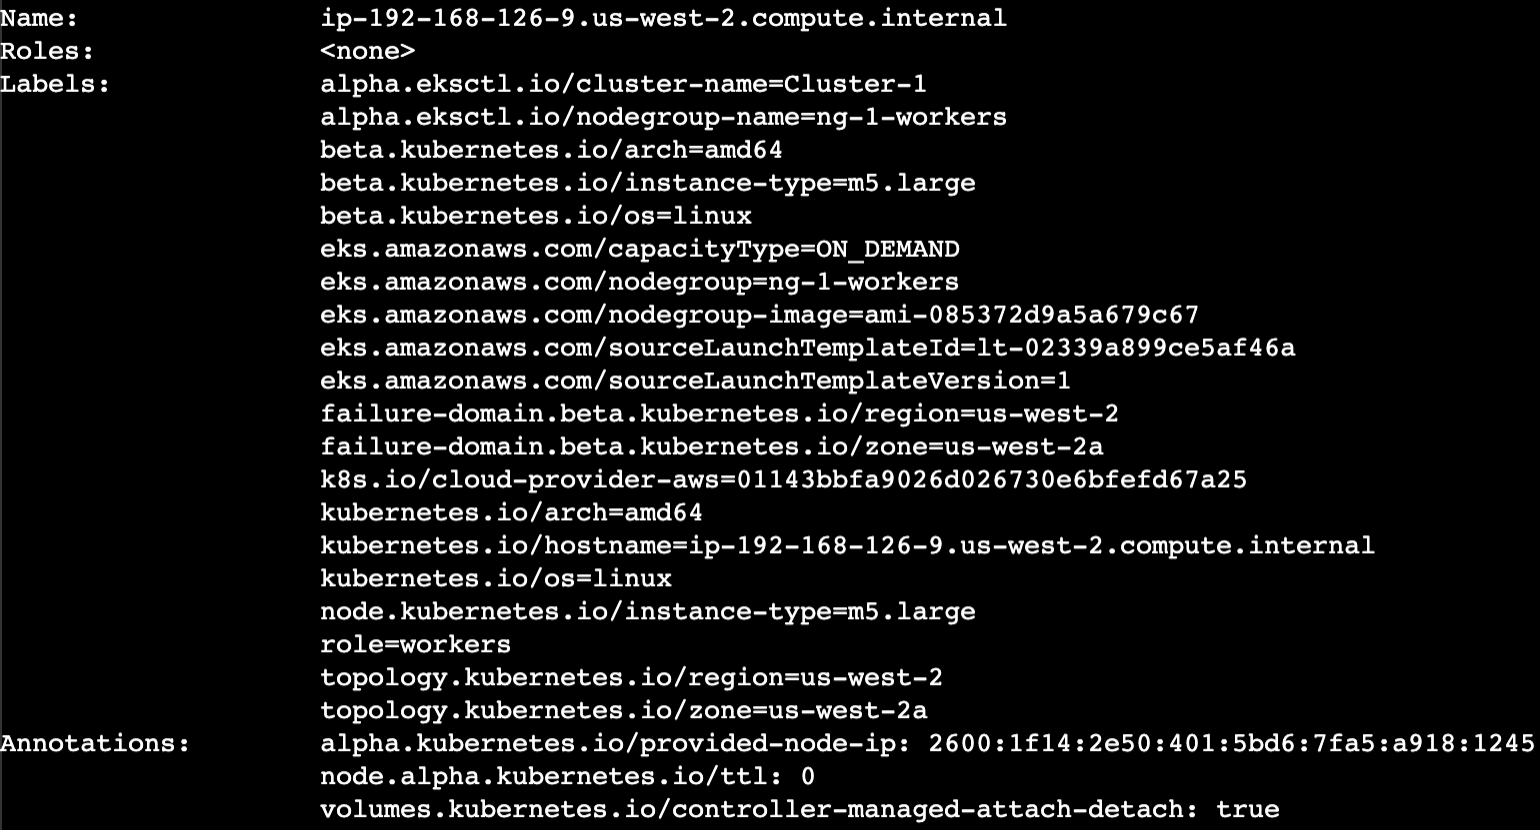
9. Use the kubectl utility to describe in more detail the EKS Cluster Worker Nodes:
1kubectl describe nodes
5
Observability using Prometheus and Grafana
0/3
0 out of 3 validations checks passed
Introduction
In this lab step, you’ll deploy a sample API and API client to generate data points and metrics that will be collected by Prometheus, opens in a new tab and displayed within Grafana, opens in a new tab. Using Helm, opens in a new tab, you’ll be required to deploy both Prometheus, opens in a new tab and Grafana, opens in a new tab. Prometheus is an open-source systems monitoring and alerting service. Grafana is an open source analytics and interactive visualization web application, providing charts, graphs, and alerts for monitoring and observability requirements. You’ll configure Grafana to connect to Prometheus as a data source. Once connected, you’ll import and deploy 2 prebuilt Grafana dashboards. You’ll configure Prometheus to perform automatic service discovery of both the sample API, and the EKS cluster itself. Prometheus once configured, will then automatically start collecting various metrics from both the sample API and the EKS cluster.
Notes:
- The Prometheus web admin interface will be exposed over the Internet on port 80, allowing you to access it from your own workstation.
- The Grafana web admin interface will be exposed over the Internet on port 80, allowing you to access it from your own workstation.
Instructions
1. Install tools and download the application code.
1{2curl -sLO https://get.helm.sh/helm-v3.7.1-linux-amd64.tar.gz3tar -xvf helm-v3.7.1-linux-amd64.tar.gz4sudo mv linux-amd64/helm /usr/local/bin5}

2. Download the observability application code and scripts. In the terminal run the following commands:
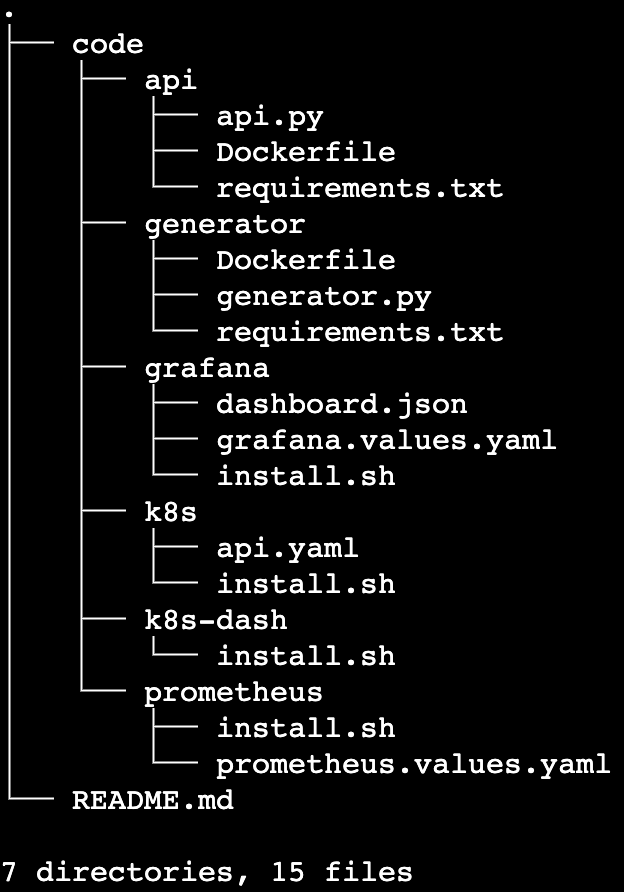
1{2mkdir -p ~/cloudacademy/observability3cd ~/cloudacademy/observability4curl -sL https://api.github.com/repos/cloudacademy/k8s-lab-observability1/releases/latest | \5 jq -r '.zipball_url' | \6 wget -qi -7unzip release* && find -type f -name *.sh -exec chmod +x {} \;8cd cloudacademy-k8s-lab-observability*9tree10}
A tree view of the downloaded project directory structure is provided:
3. Install the sample API and API client cluster resources.
Note: All of the source code as used within this lab is located online here:
https://github.com/cloudacademy/k8s-lab-observability1, opens in a new tab
Note: Before installing, examine the source code that makes up the Python based API and API client.
The ./code/api directory contains 3 files which have been used to build the cloudacademydevops/api-metrics container image.
Open each of the following files within your editor of choice.
- api.py
- Dockerfile
- requirements.txt
The api.py file contains the Python source code which implements the example API.
In particular take note of the following:
- Line 5 – imports a PromethusMetrics module to automatically generate Flask based metrics and provide them for collection at the default endpoint /metrics
- Line 10-32 – implements 5 x API endpoints:
- /one
- /two
- /three
- /four
- /error
- All example endpoints, except for the error endpoint, introduce a small amount of latency which will be measured and observed within both Prometheus and Grafana.
- The error endpoint returns an HTTP 500 server error response code, which again will be measured and observed within both Prometheus and Grafana.
- The Docker container image containing this source code has already been built using the tag cloudacademydevops/api-metrics
./code/k8s directory contains the api.yaml Kubernetes manifest file used to deploy the API into the cluster.
Open each of the following files within your editor of choice.
- api.yaml
In particular note the following:
- Lines 1-25: API Deployment containing 2 pods
- Line 22: Pods are based off the container image cloudacademydevops/api-metrics
- Lines 27-46: API Service – load balances traffic across the 2 API Deployment pods
- Lines 34-37: API Service is annotated to ensure that the Prometheus scraper will automatically discover the API pods behind it. Prometheus will then collect their metrics from the discovered targets
3. The API and API client need to be deployed into the cloudacademy namespace which needs to be created. Create the new namespace. In the terminal execute the following command:
1kubectl create ns cloudacademy
4. Navigate into the k8s directory and perform a directory listing. In the terminal execute the following commands:
1cd ./code/k8s && ls -la

5. Deploy the sample API into the newly created namespace. In the terminal execute the following command
1kubectl apply -f ./api.yaml
6. Deploy the sample API client into the newly created namespace. In the terminal execute the following command
1kubectl run api-client \2 --namespace=cloudacademy \3 --image=cloudacademydevops/api-generator \4 --env="API_URL=http://api-service:5000" \5 --image-pull-policy IfNotPresent
7. Wait for the sample API and API client resources to start up. In the terminal run the following commands:
1{2kubectl wait --for=condition=available --timeout=300s deployment/api -n cloudacademy3kubectl wait --for=condition=ready --timeout=300s pod/api-client -n cloudacademy4}
8. Confirm that the sample API and API client cluster resources have all started successfully. In the terminal run the following commands:
1kubectl get all -n cloudacademy

9. Install Prometheus into the cluster.
Prometheus will be deployed into the prometheus namespace which needs to be created. Create a new namespace named prometheus. In the terminal run the follwing command:
1kubectl create ns prometheus
10. Navigate into the prometheus directory and perform a directory listing. In the terminal execute the following commands:
1cd ../prometheus && ls -la2sed -i 's/extraEnv: {}/extraEnv:/g' prometheus.values.yaml

11. With Helm, install Prometheus using it’s publicly available Helm Chart. Deploy Prometheus into the prometheus namespace. In the terminal execute the following commands:
1{2helm repo add prometheus-community https://prometheus-community.github.io/helm-charts3helm repo update4helm install prometheus prometheus-community/prometheus \5 --namespace prometheus \6 --set alertmanager.persistentVolume.storageClass="gp2" \7 --set server.persistentVolume.storageClass="gp2" \8 --values ./prometheus.values.yaml9}
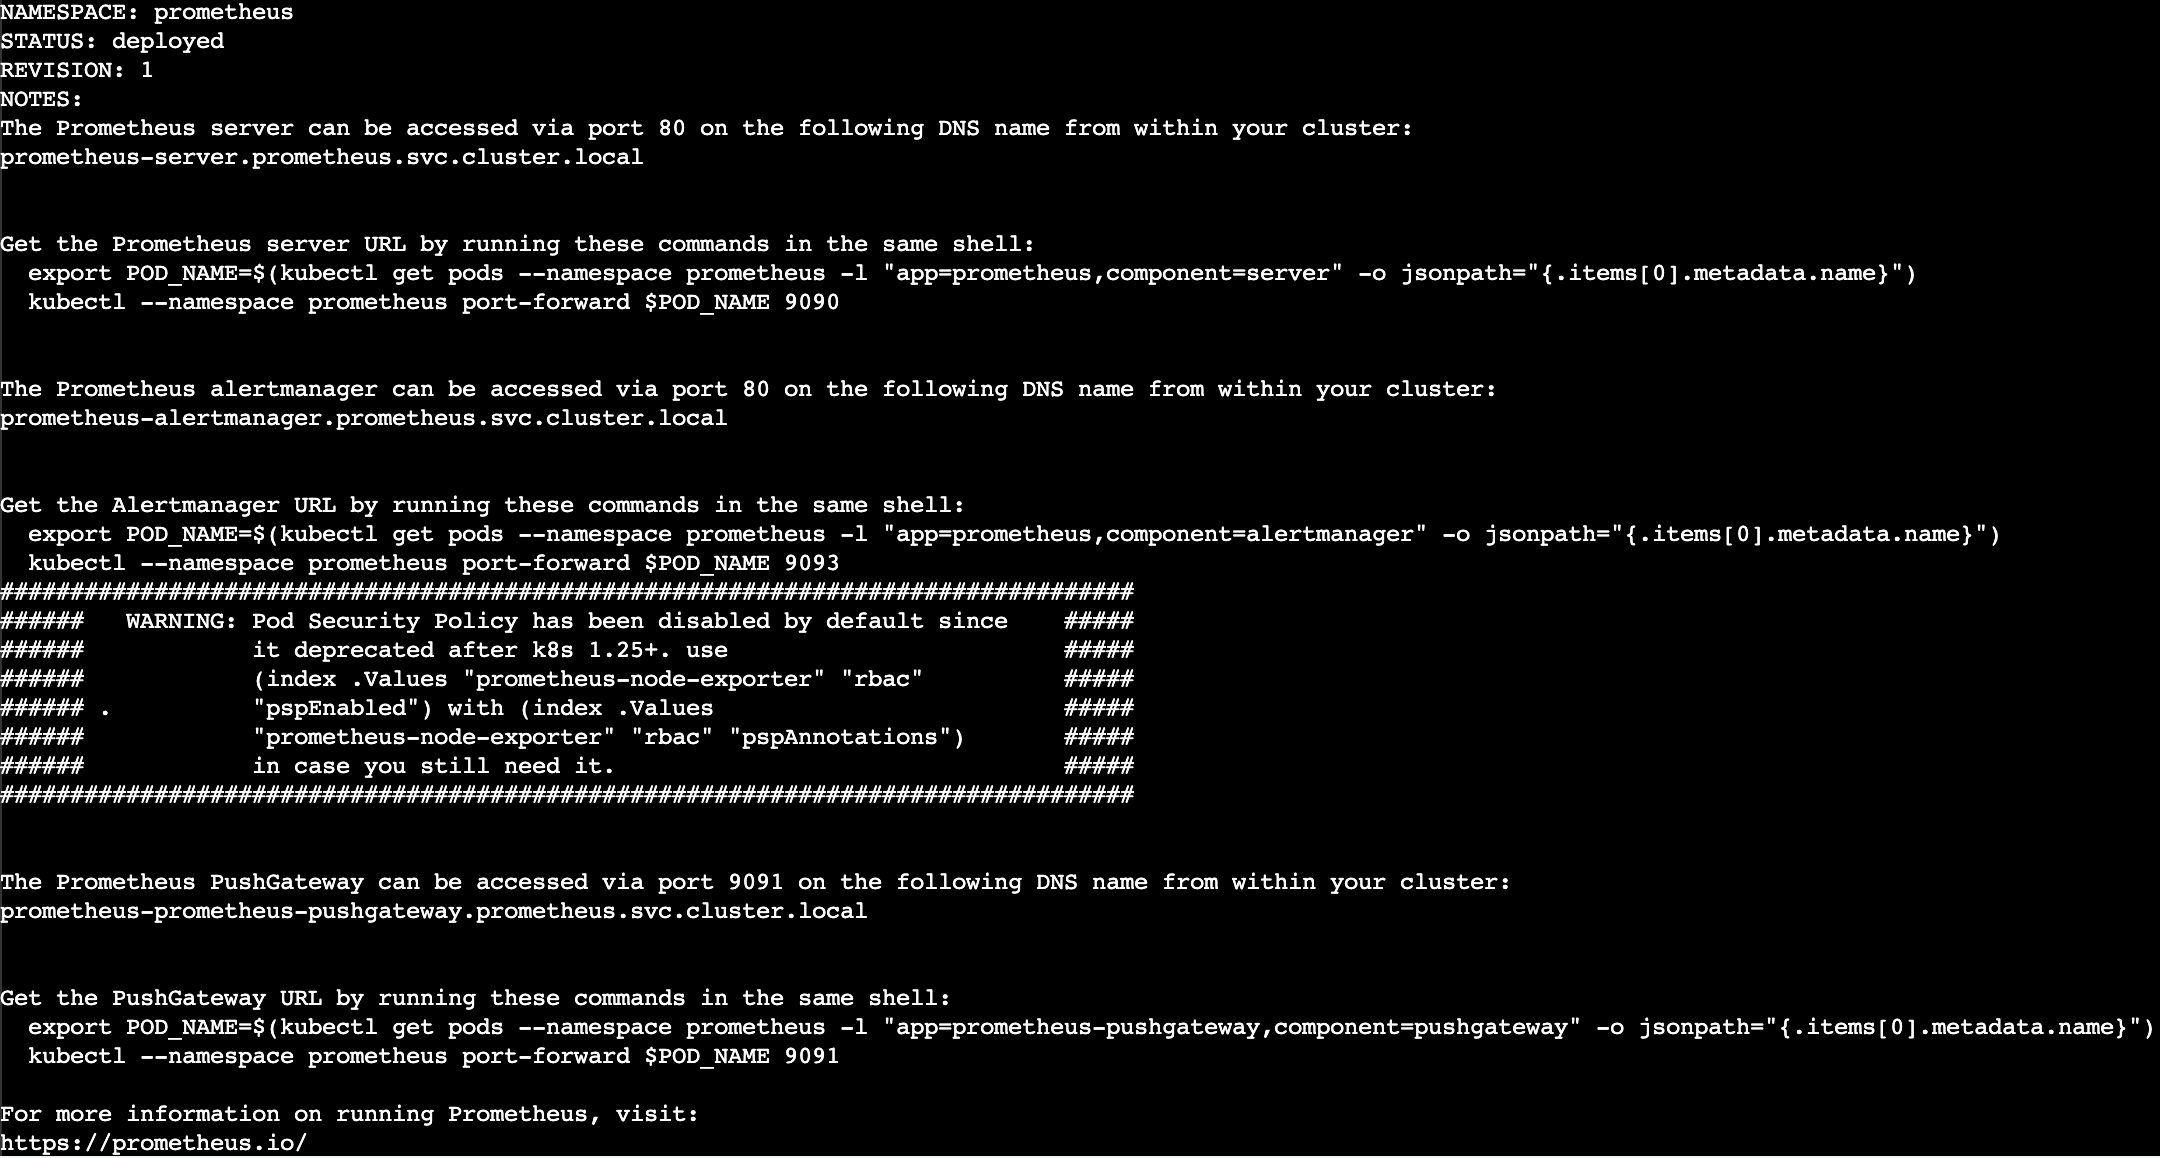
12. Expose the Prometheus web application. In the terminal run the following commands:
1kubectl expose deployment prometheus-server \2 --namespace prometheus \3 --name=prometheus-server-loadbalancer \4 --type=LoadBalancer \5 --port=80 \6 --target-port=9090
13. Wait for the Prometheus application to start up. In the terminal run the following commands:
1{2kubectl wait --for=condition=available --timeout=300s deployment/prometheus-kube-state-metrics -n prometheus3kubectl wait --for=condition=available --timeout=300s deployment/prometheus-prometheus-pushgateway -n prometheus4kubectl wait --for=condition=available --timeout=300s deployment/prometheus-server -n prometheus5}
14. Confirm that the Prometheus cluster resources have all started successfully. In the terminal run the following commands:
1kubectl get all -n prometheus
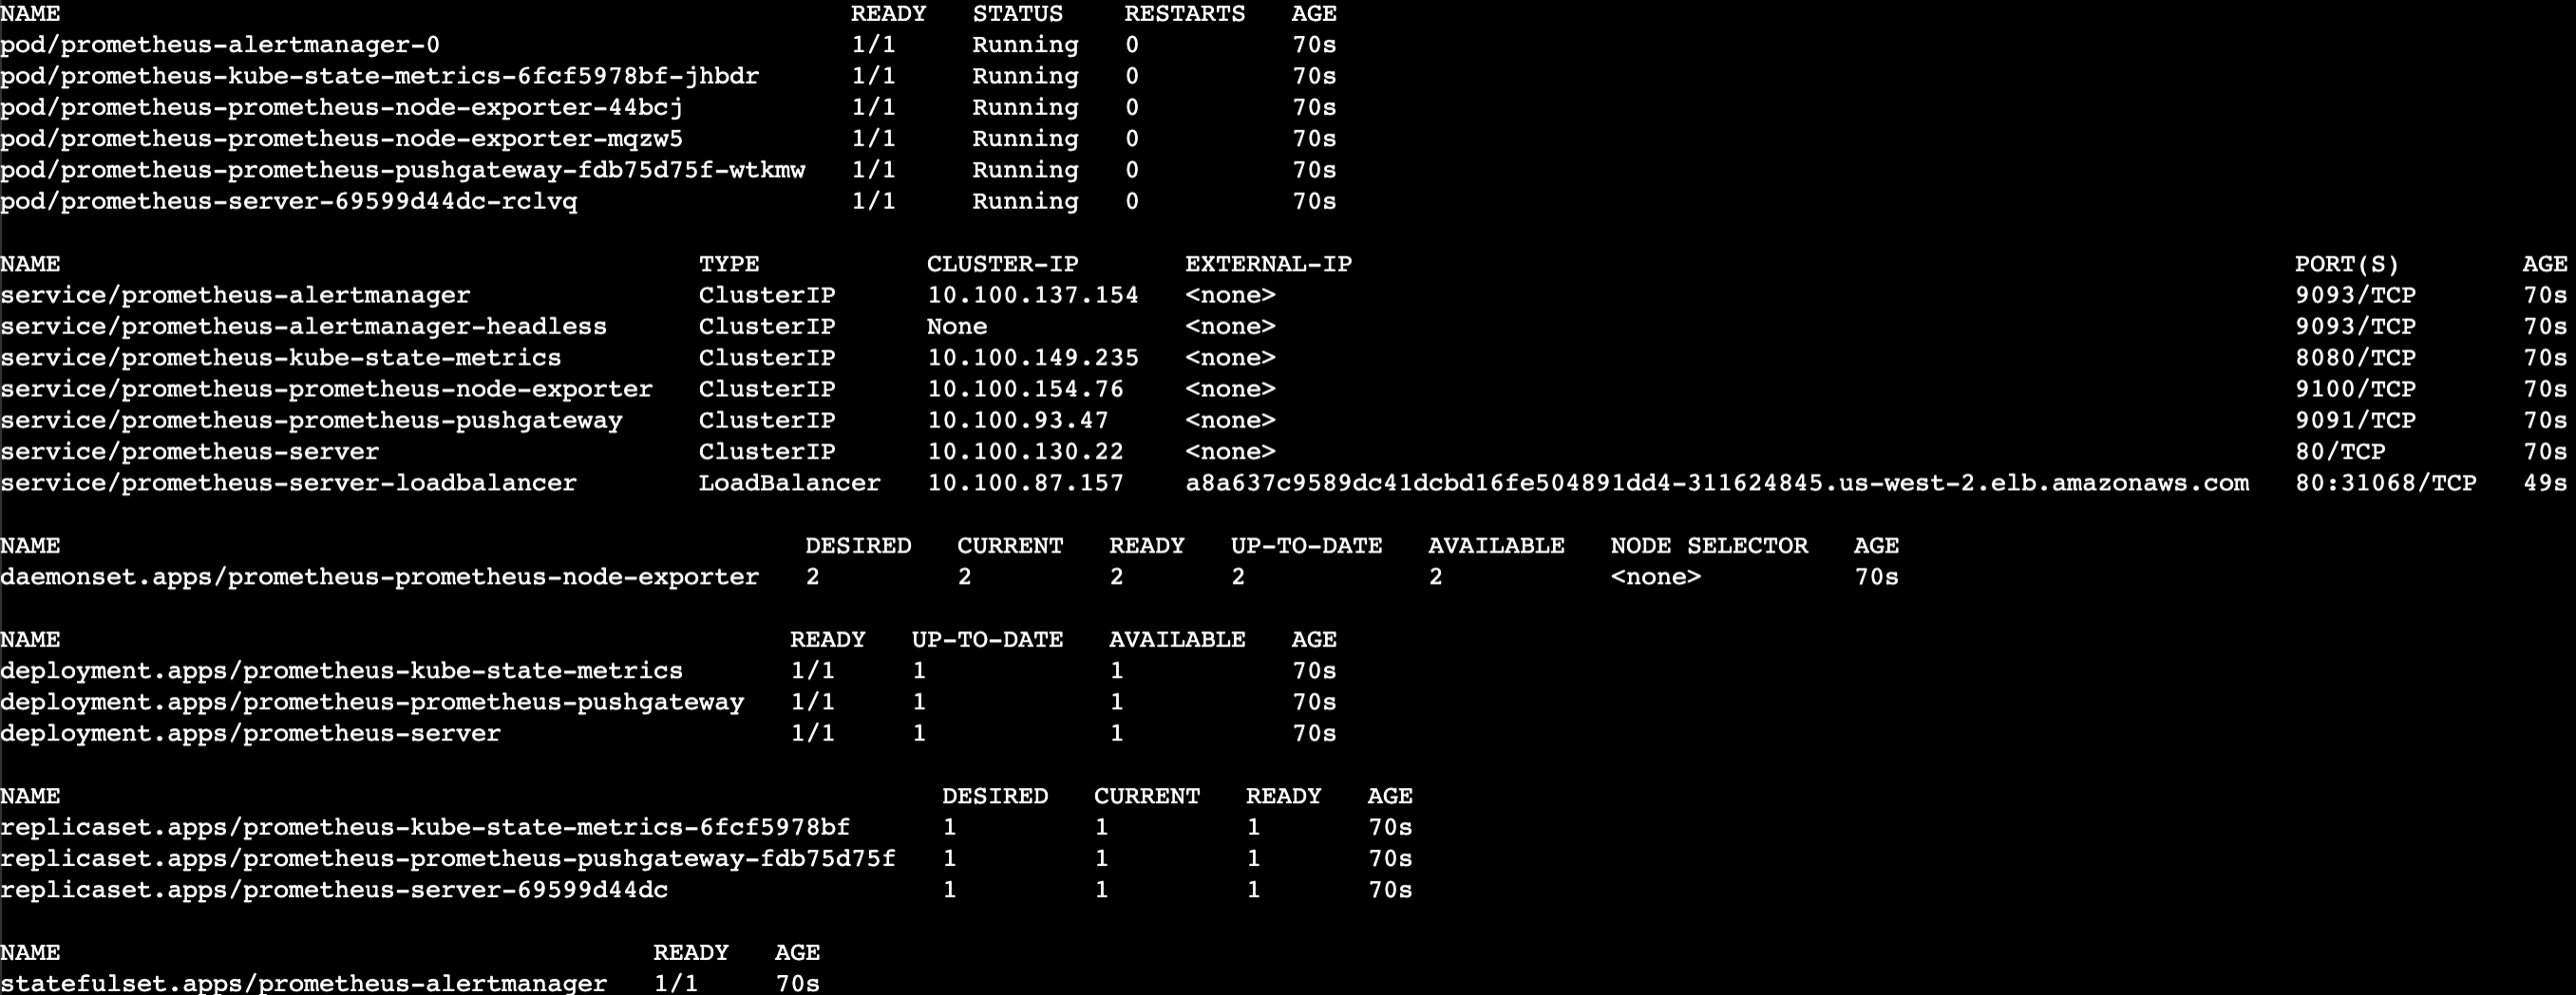
15. Retrieve the Prometheus web application URL.
Confirm that the Prometheus ELB FQDN has propageted and resolves. In the terminal run the following commands:
1{2PROMETHEUS_ELB_FQDN=$(kubectl get svc -n prometheus prometheus-server-loadbalancer -o jsonpath='{.status.loadBalancer.ingress[0].hostname}')3until nslookup $PROMETHEUS_ELB_FQDN >/dev/null 2>&1; do sleep 2 && echo waiting for DNS to propagate...; done4curl -sD - -o /dev/null $PROMETHEUS_ELB_FQDN/graph5}
Note: DNS propagation can take up to 2-5 minutes, please be patient while the propagation proceeds – it will eventually complete.
16. Generate the Prometheus web application URL:
1echo http://$PROMETHEUS_ELB_FQDN
17. Using your workstation’s browser, copy the Prometheus URL from the previous output and browse to it:
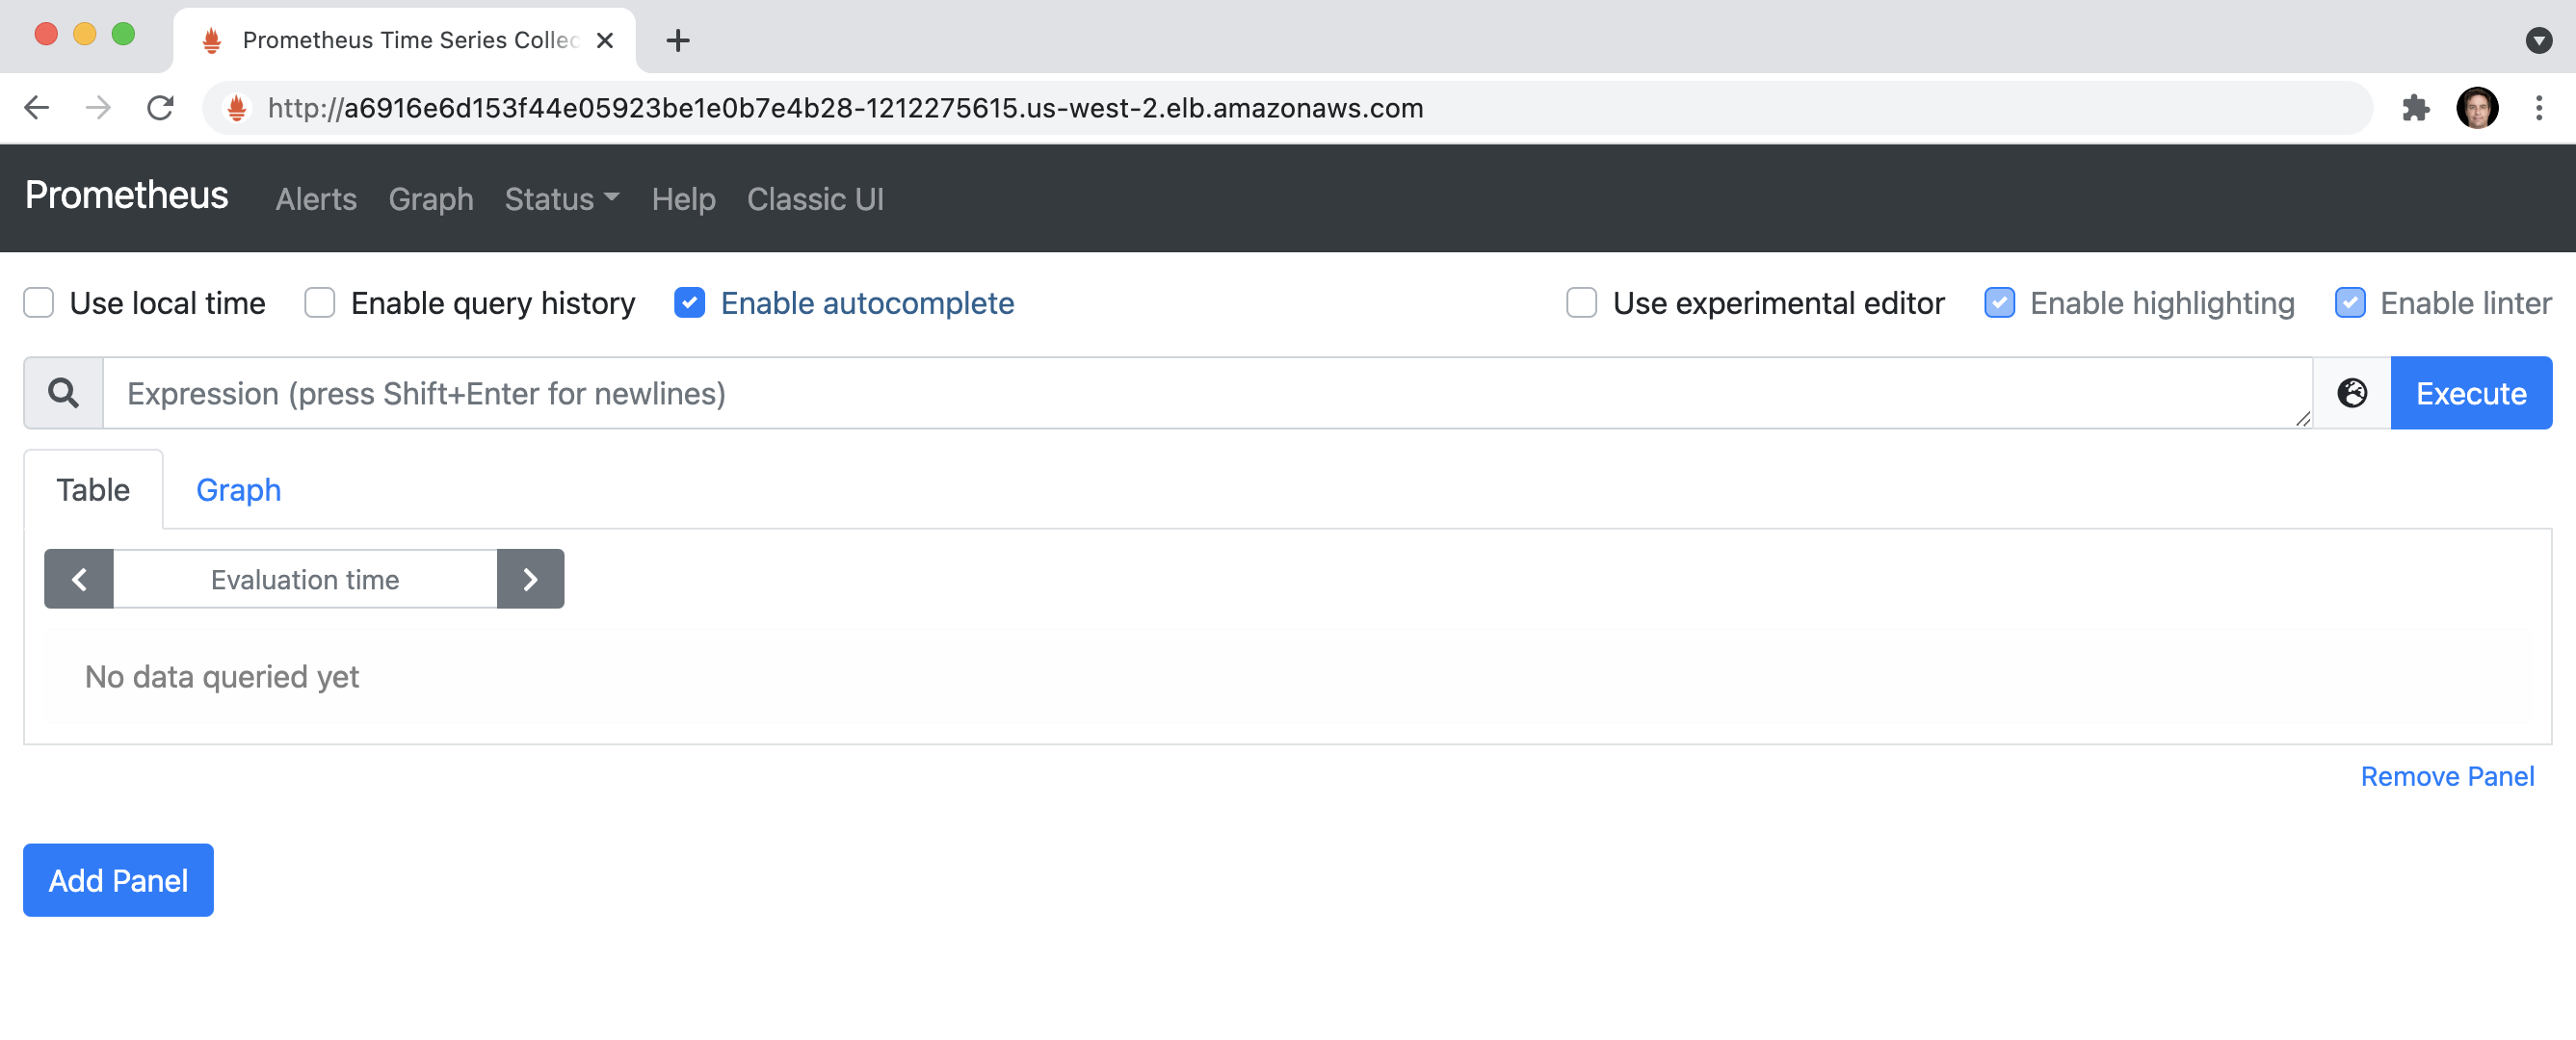
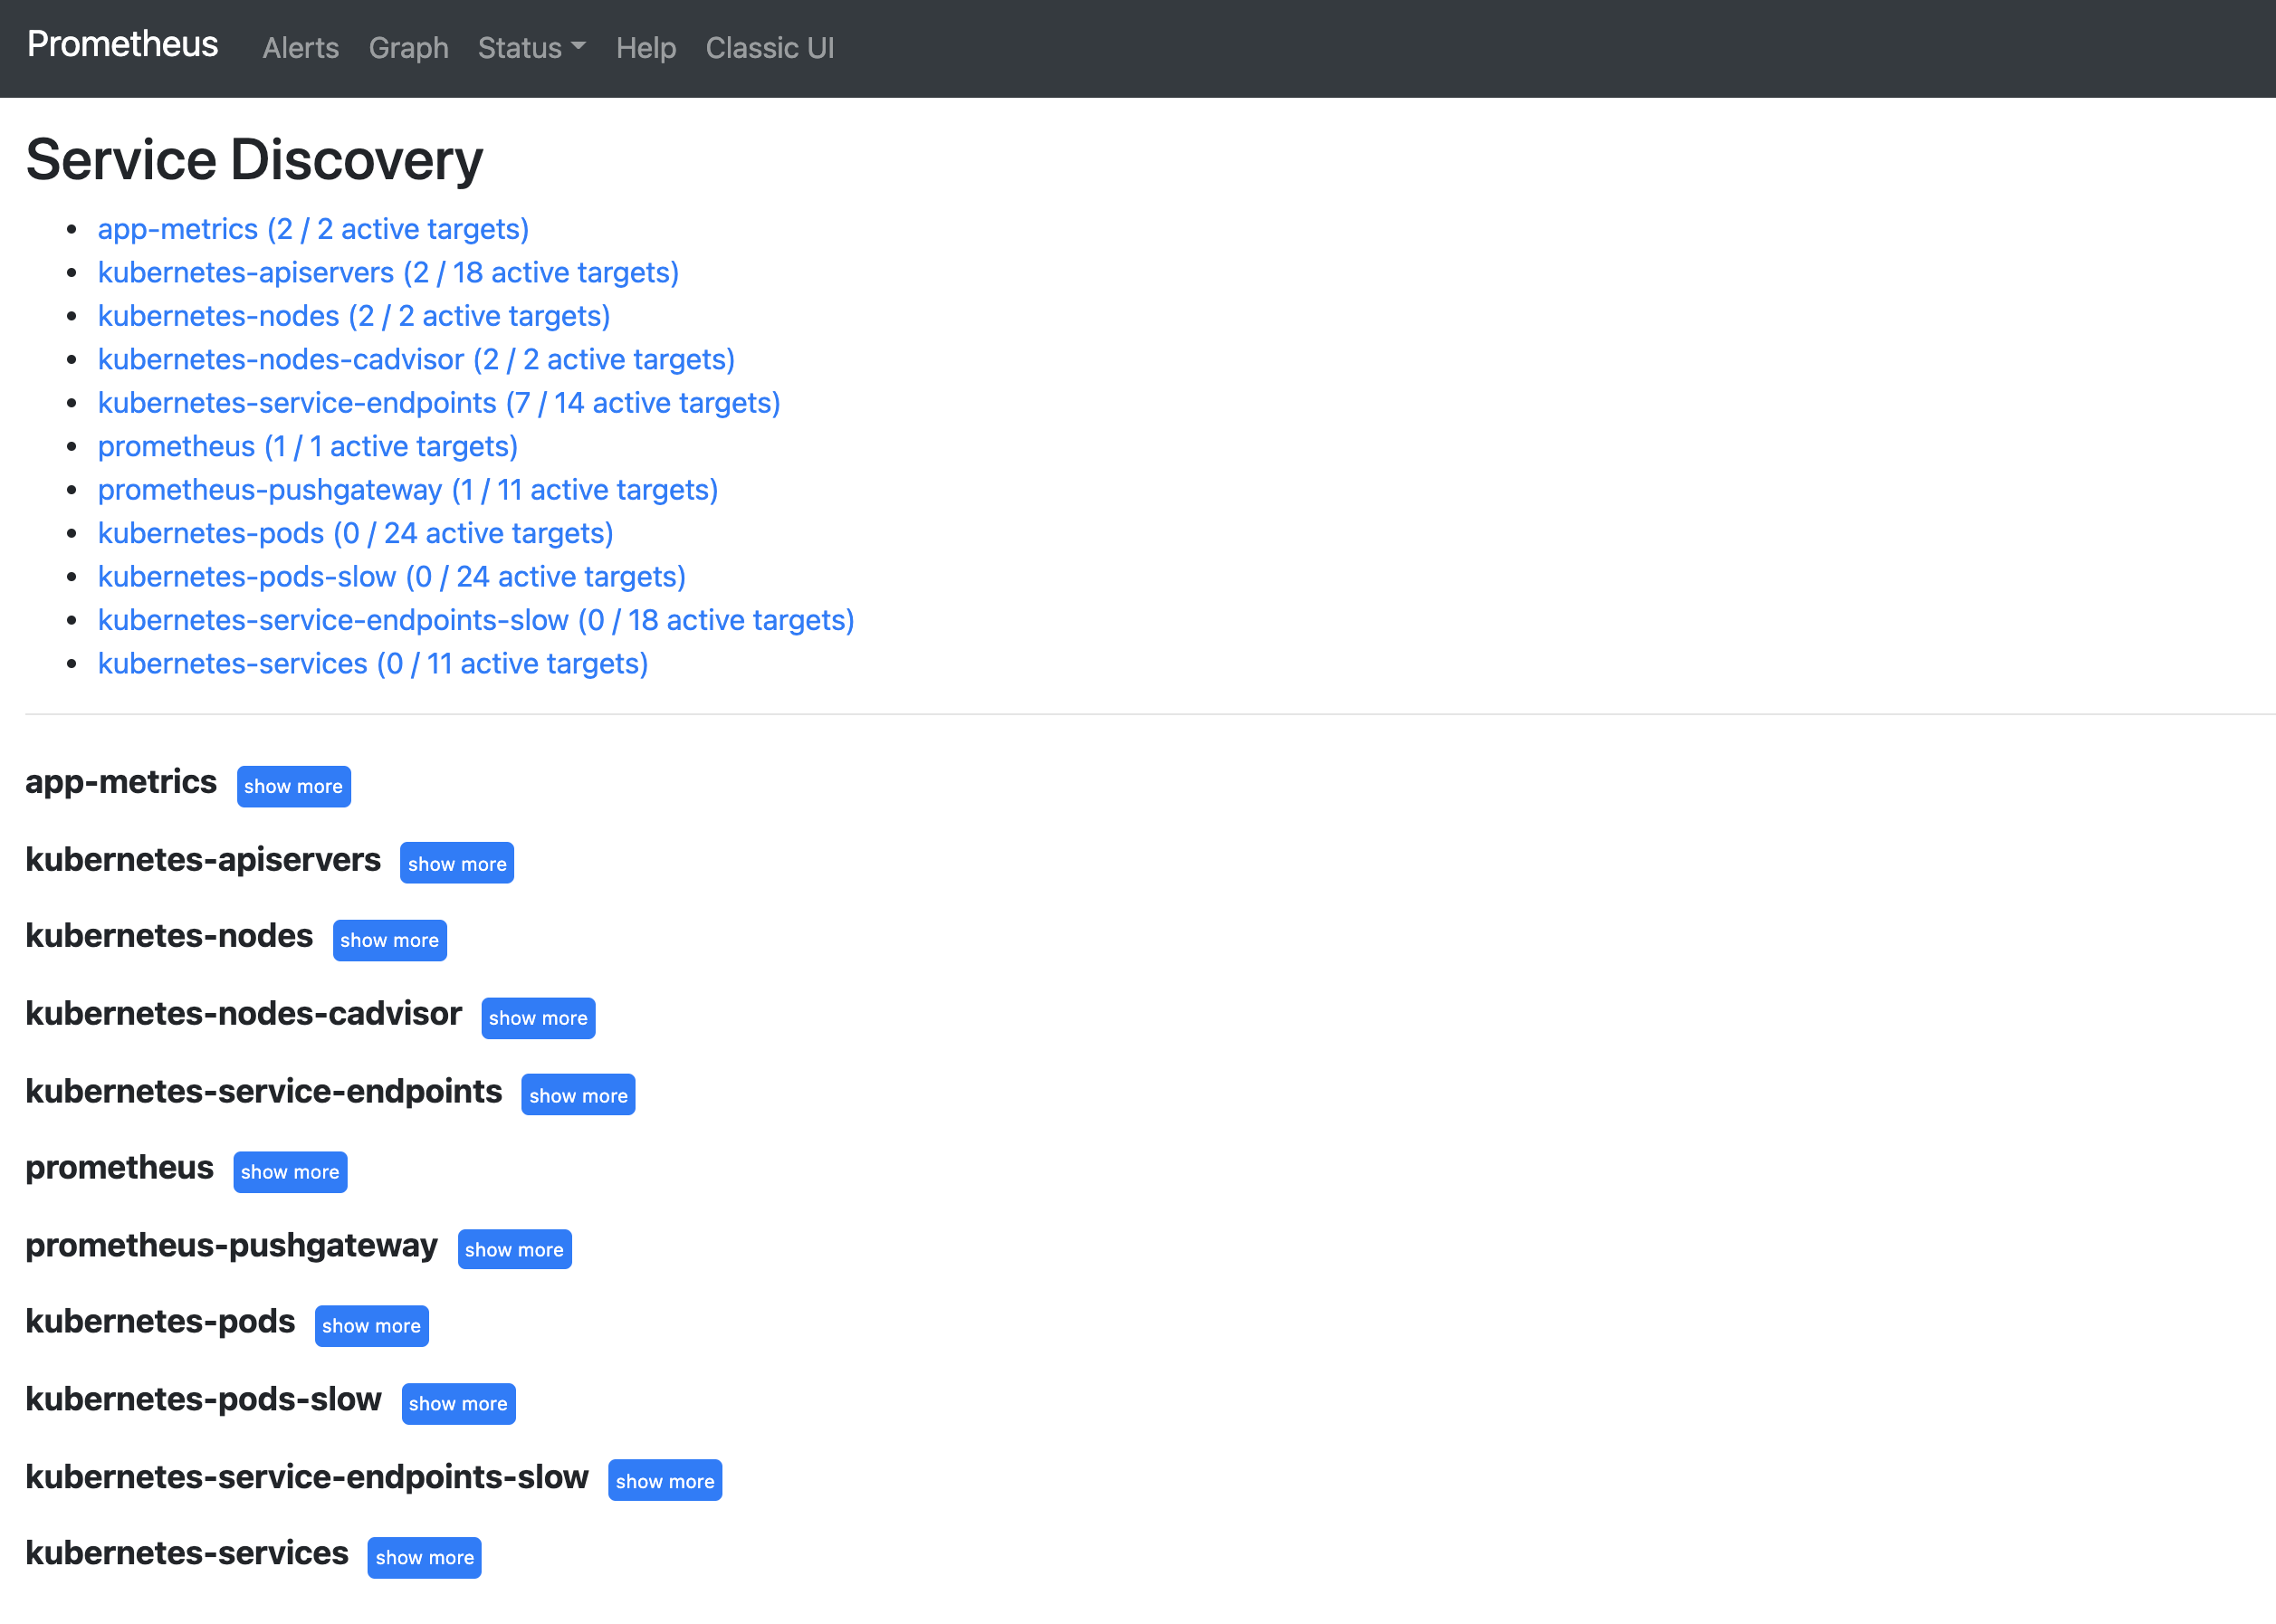
18. Within the Prometheus web application, click the Status top menu item and then select Service Discovery:
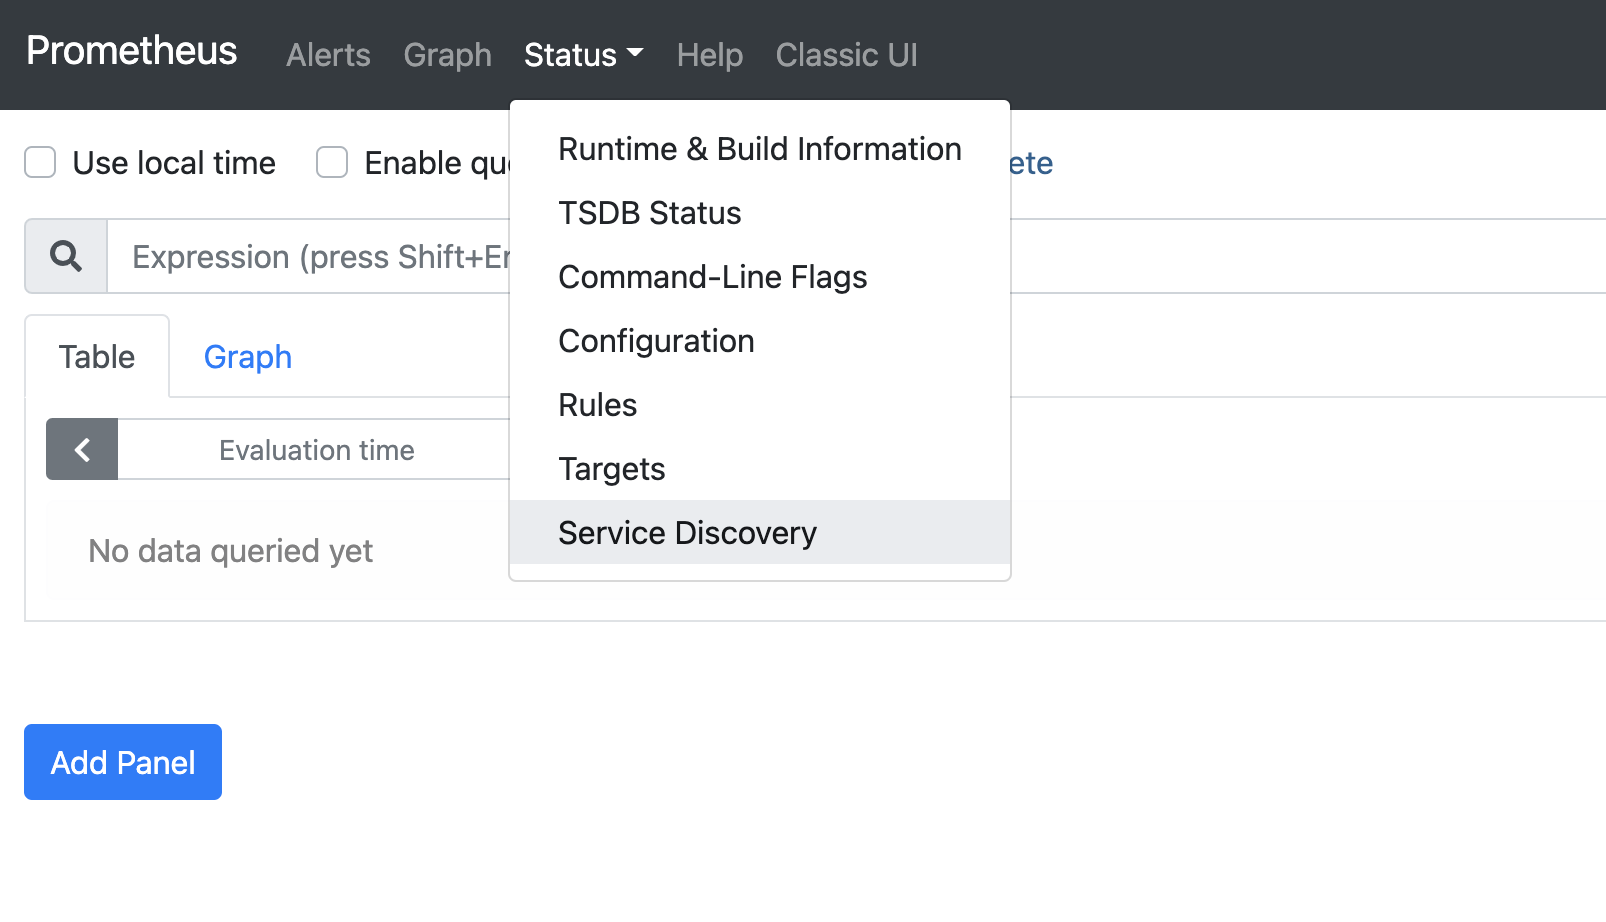
19. Confirm that the following service discovery targets have been configured:
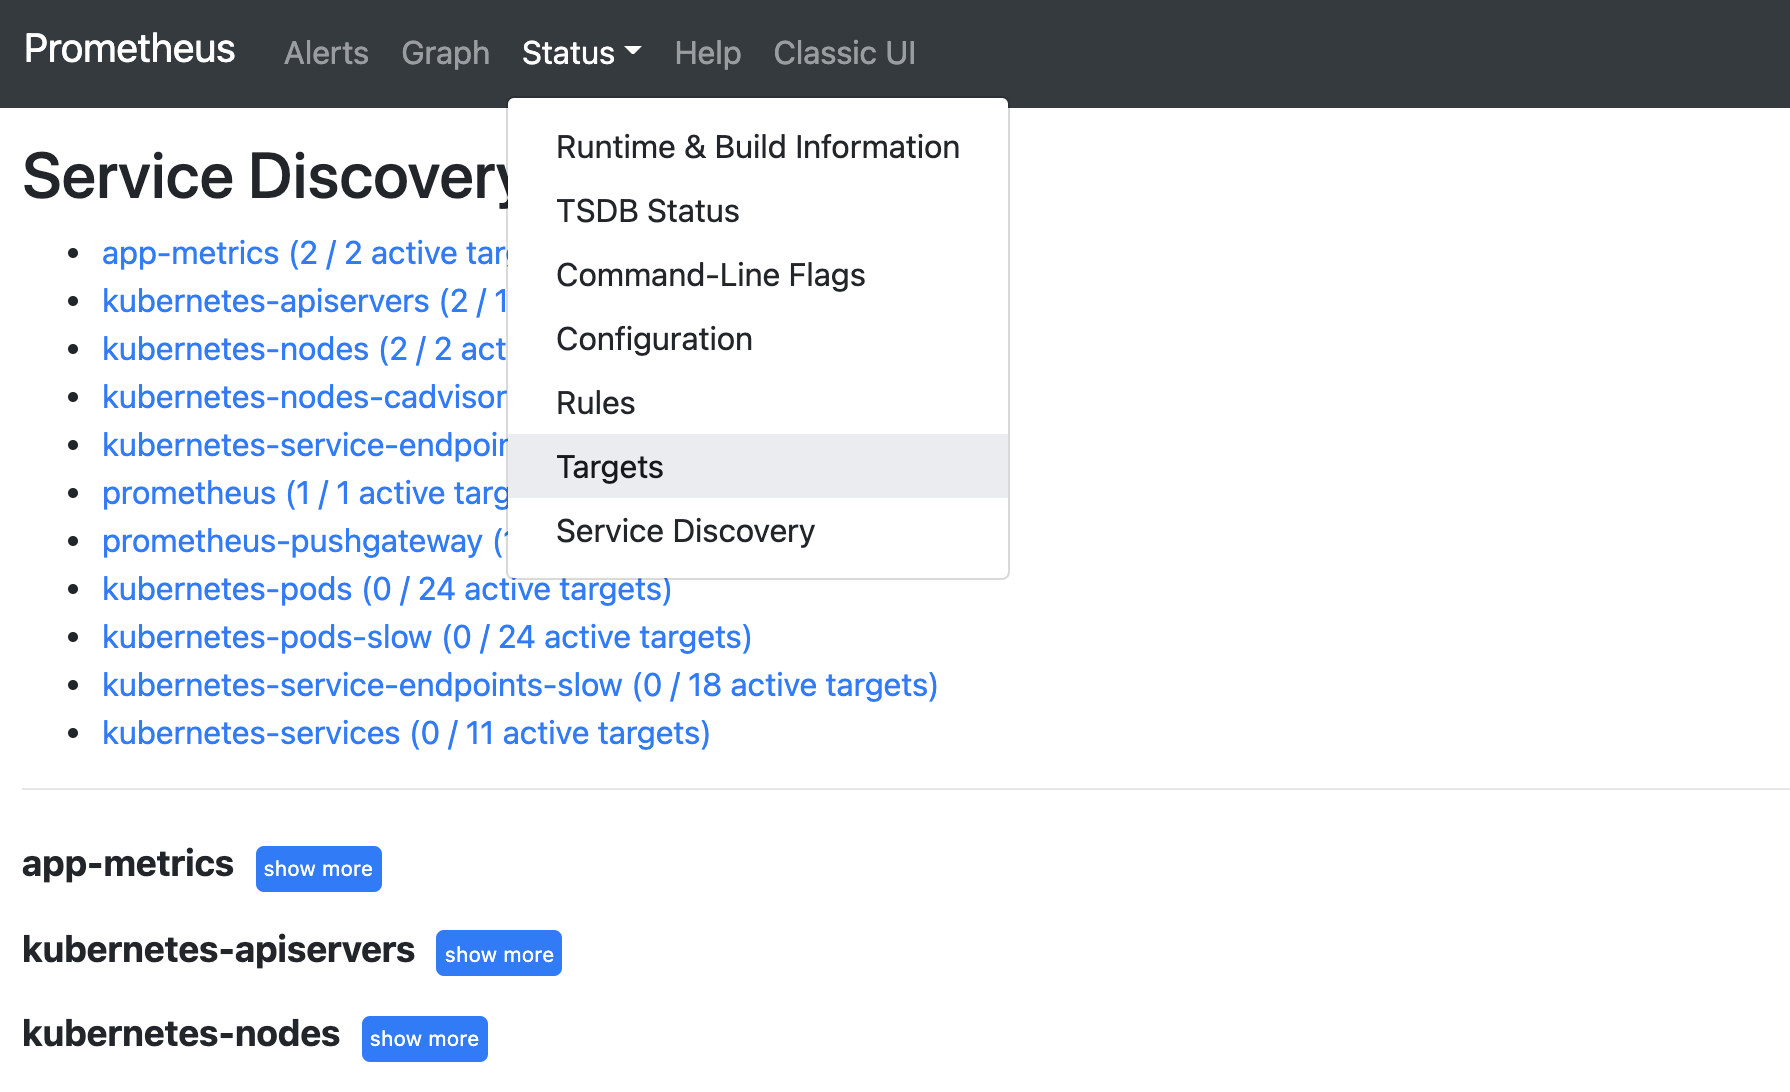
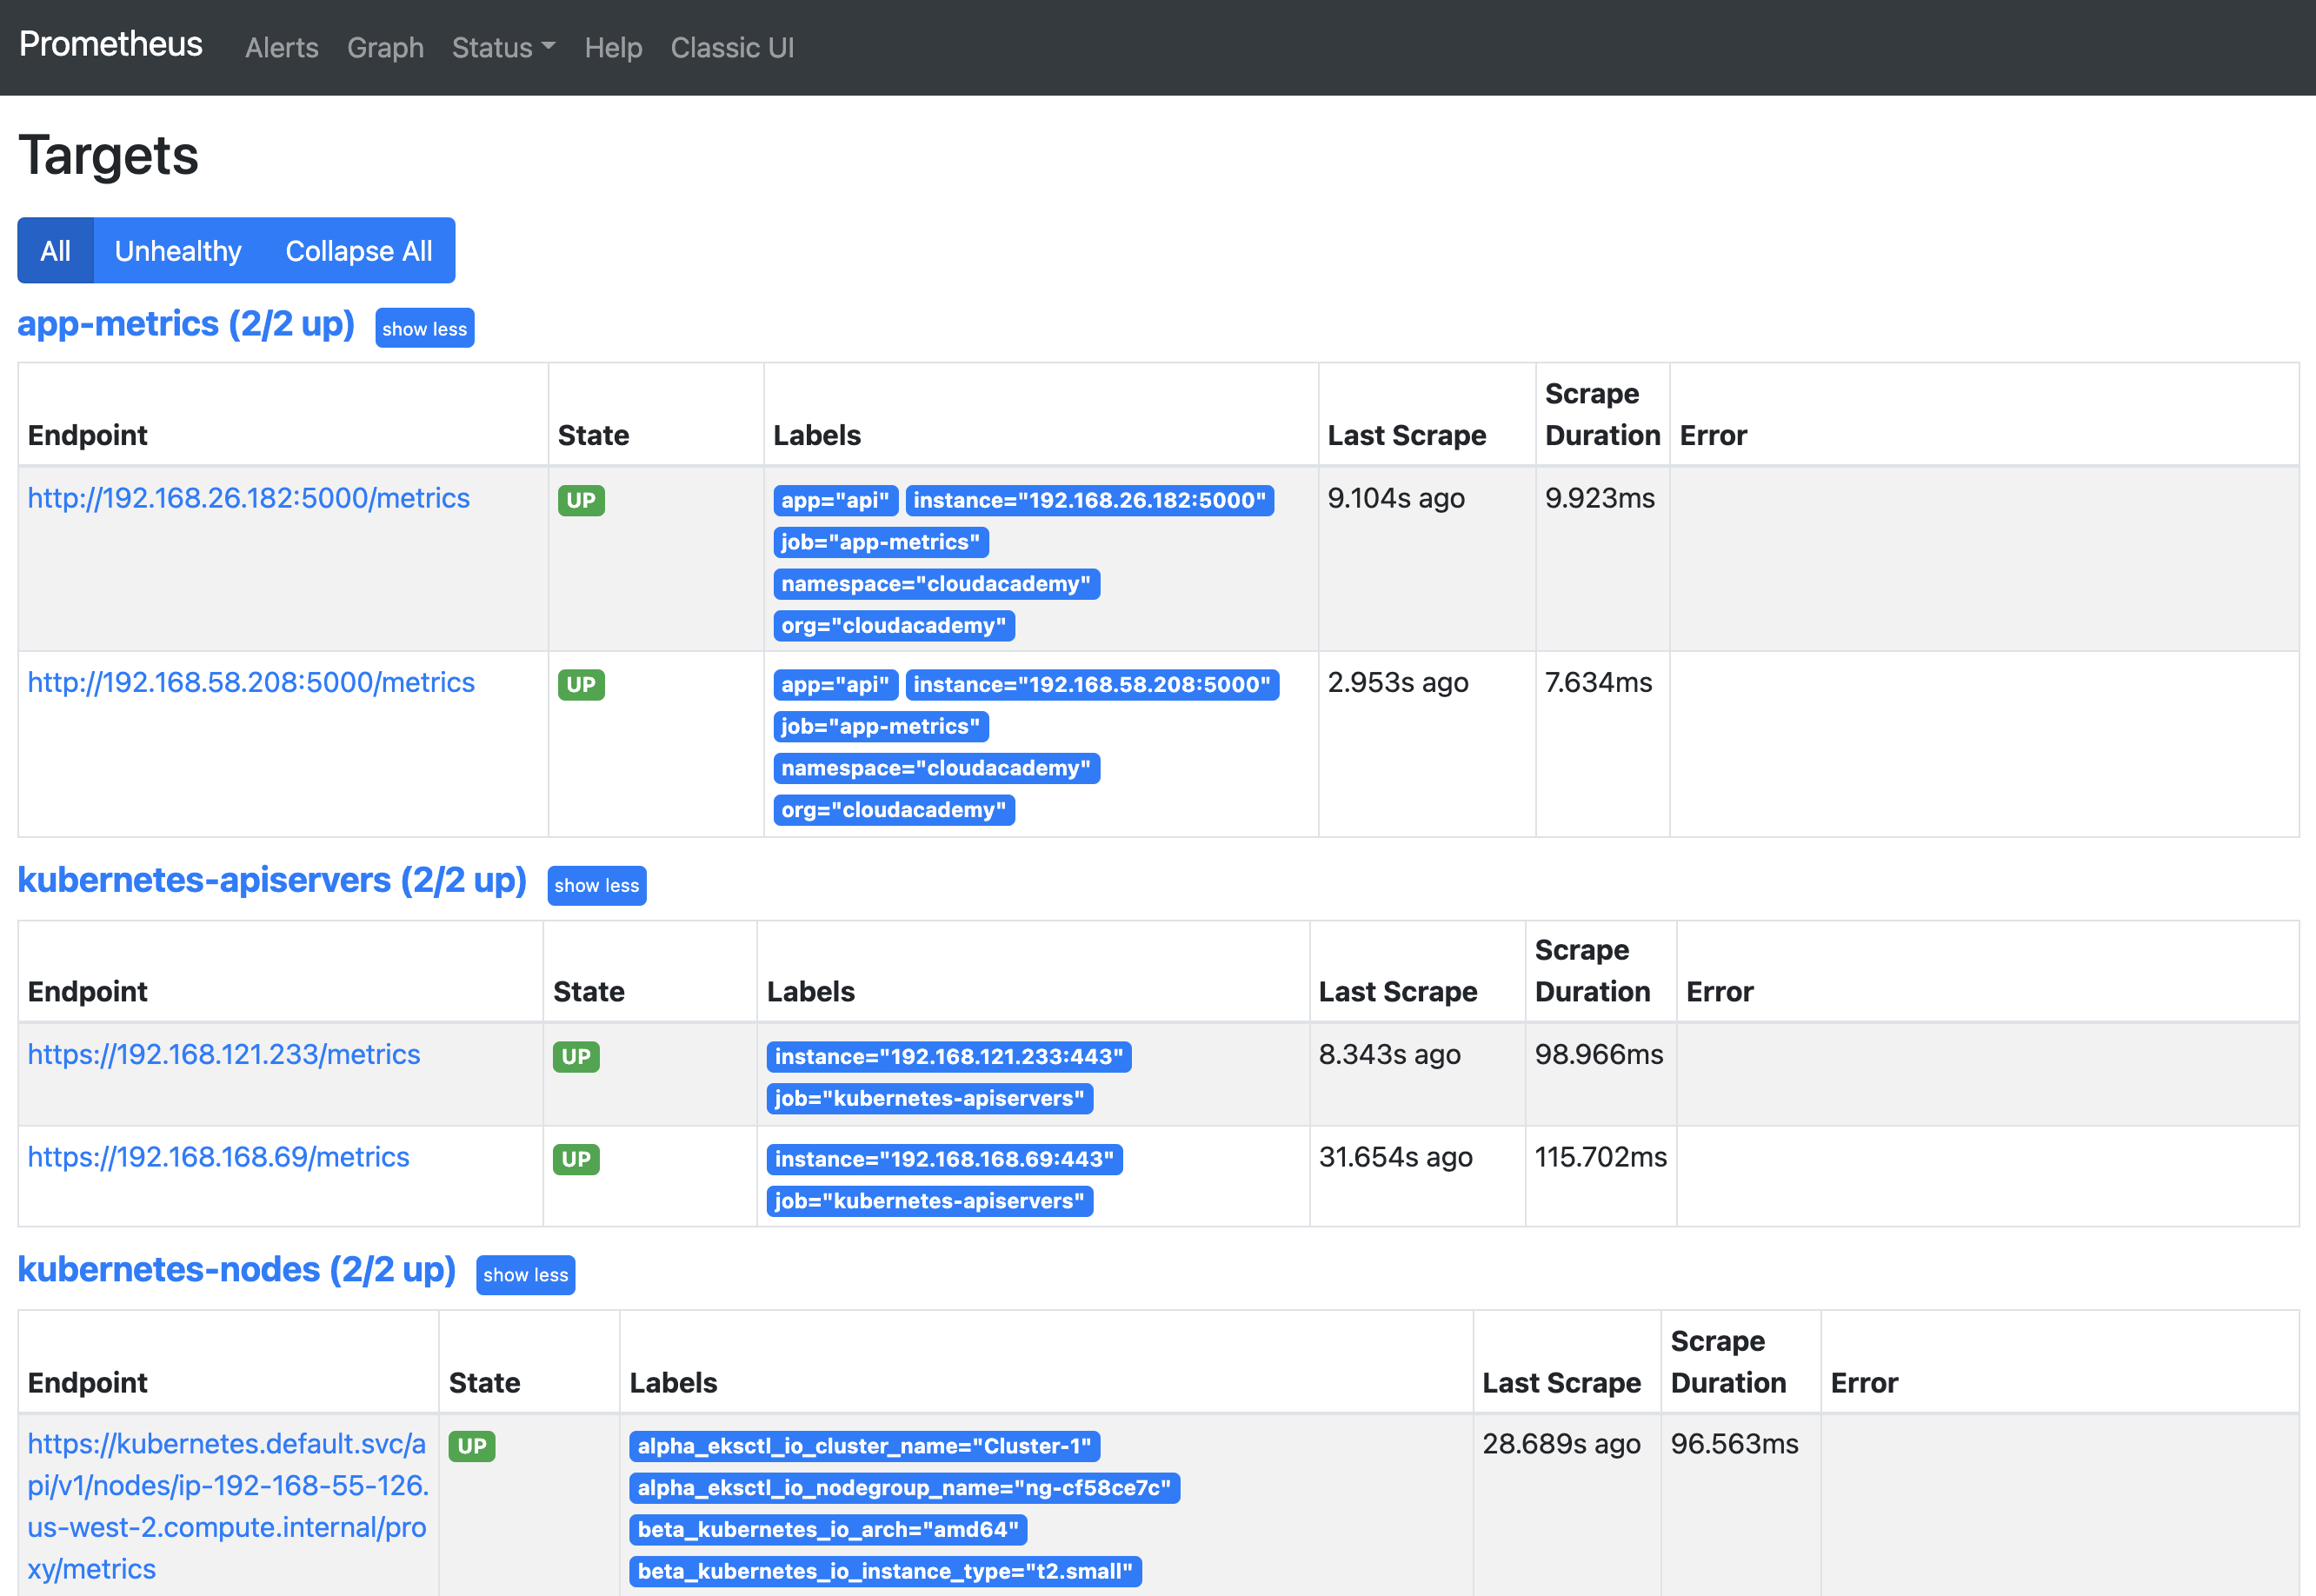
20. Within Prometheus, click the Status top menu item and then select Targets:
21. Confirm that the following Targets are available:
22. Install Grafana into the cluster. Grafana will be deployed into the grafana namespace which needs to be created.
Navigate into the grafana directory and perform a directory listing. In the terminal execute the following commands:
1cd ../grafana && ls -la

23. Create a new namespace named grafana. In the terminal run the follwing command:
1kubectl create ns grafana
24. install Grafana using it’s publicly available Helm Chart. Deploy Grafana into the grafana namespace. In the terminal execute the following commands:
1{2helm repo add grafana https://grafana.github.io/helm-charts3helm repo update4helm install grafana grafana/grafana \5 --namespace grafana \6 --set persistence.storageClassName="gp2" \7 --set persistence.enabled=true \8 --set adminPassword="EKS:l3t5g0" \9 --set service.type=LoadBalancer \10 --values ./grafana.values.yaml11}
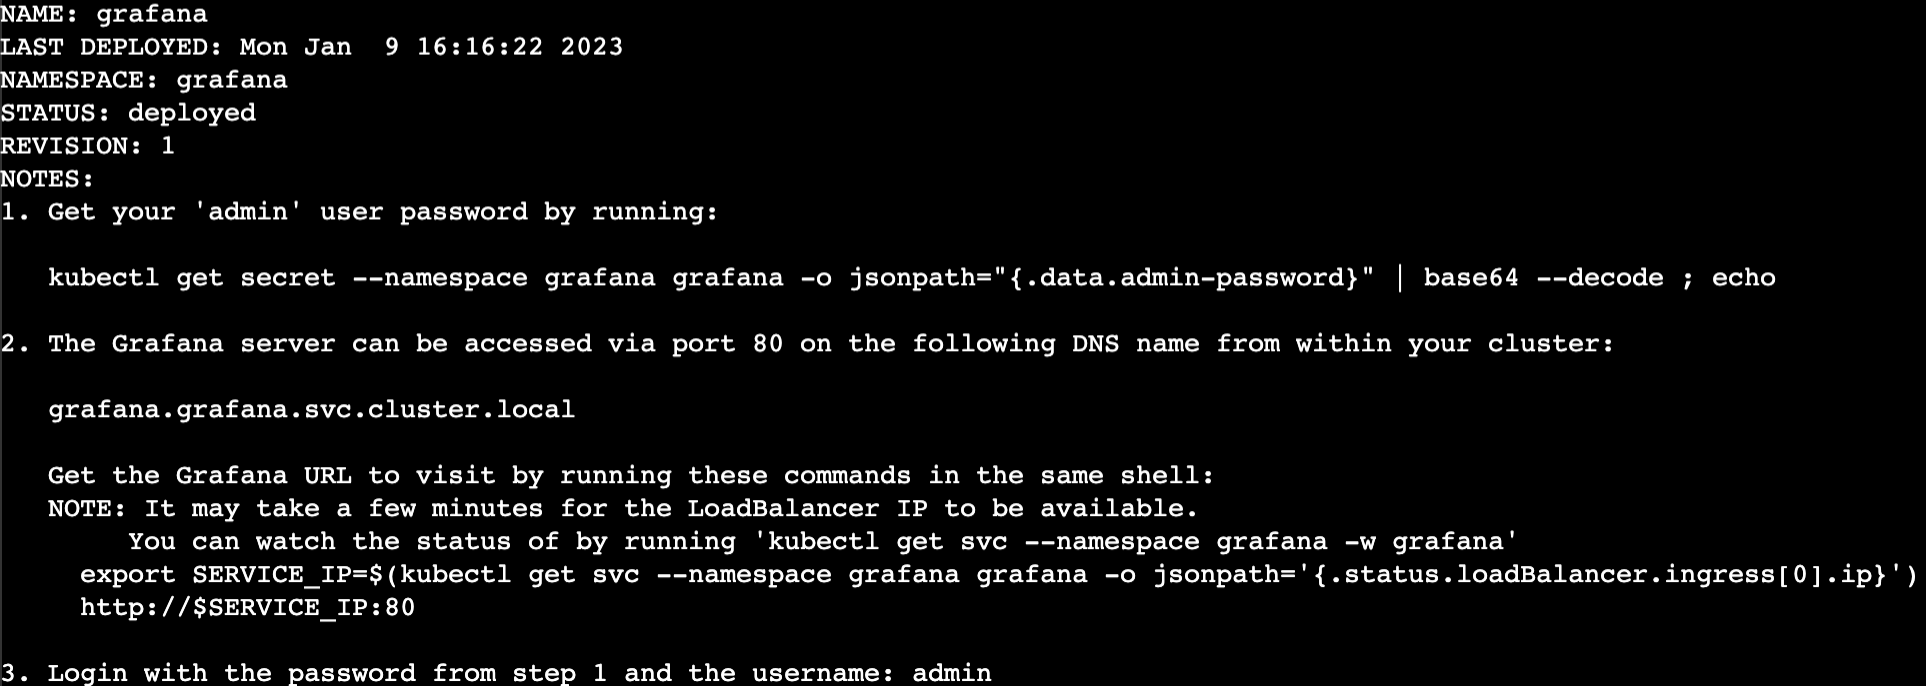
Note: The PodSecurityPolicy deprecation warnings can be safely ignored.
25. Wait for the Grafana application to start up. In the terminal run the following command:
1kubectl wait --for=condition=available --timeout=300s deployment/grafana -n grafana
26. Confirm that the Grafana cluster resources have all started successfully. In the terminal run the following commands:
1kubectl get all -n grafana

27. Retrieve the Grafana web application URL.
Confirm that the Grafana ELB FQDN has propagated and resolves. In the terminal run the following commands:
1{2GRAFANA_ELB_FQDN=$(kubectl get svc -n grafana grafana -o jsonpath='{.status.loadBalancer.ingress[0].hostname}')3until nslookup $GRAFANA_ELB_FQDN >/dev/null 2>&1; do sleep 2 && echo waiting for DNS to propagate...; done4curl -I $GRAFANA_ELB_FQDN/login5}
Note: DNS propagation can take up to 2-5 minutes, please be patient while the propagation proceeds – it will eventually complete.
28. Generate the Grafana web application URL:
1echo http://$GRAFANA_ELB_FQDN
29. Using your workstation’s browser, copy the Grafana URL from the previous output and browse to it:
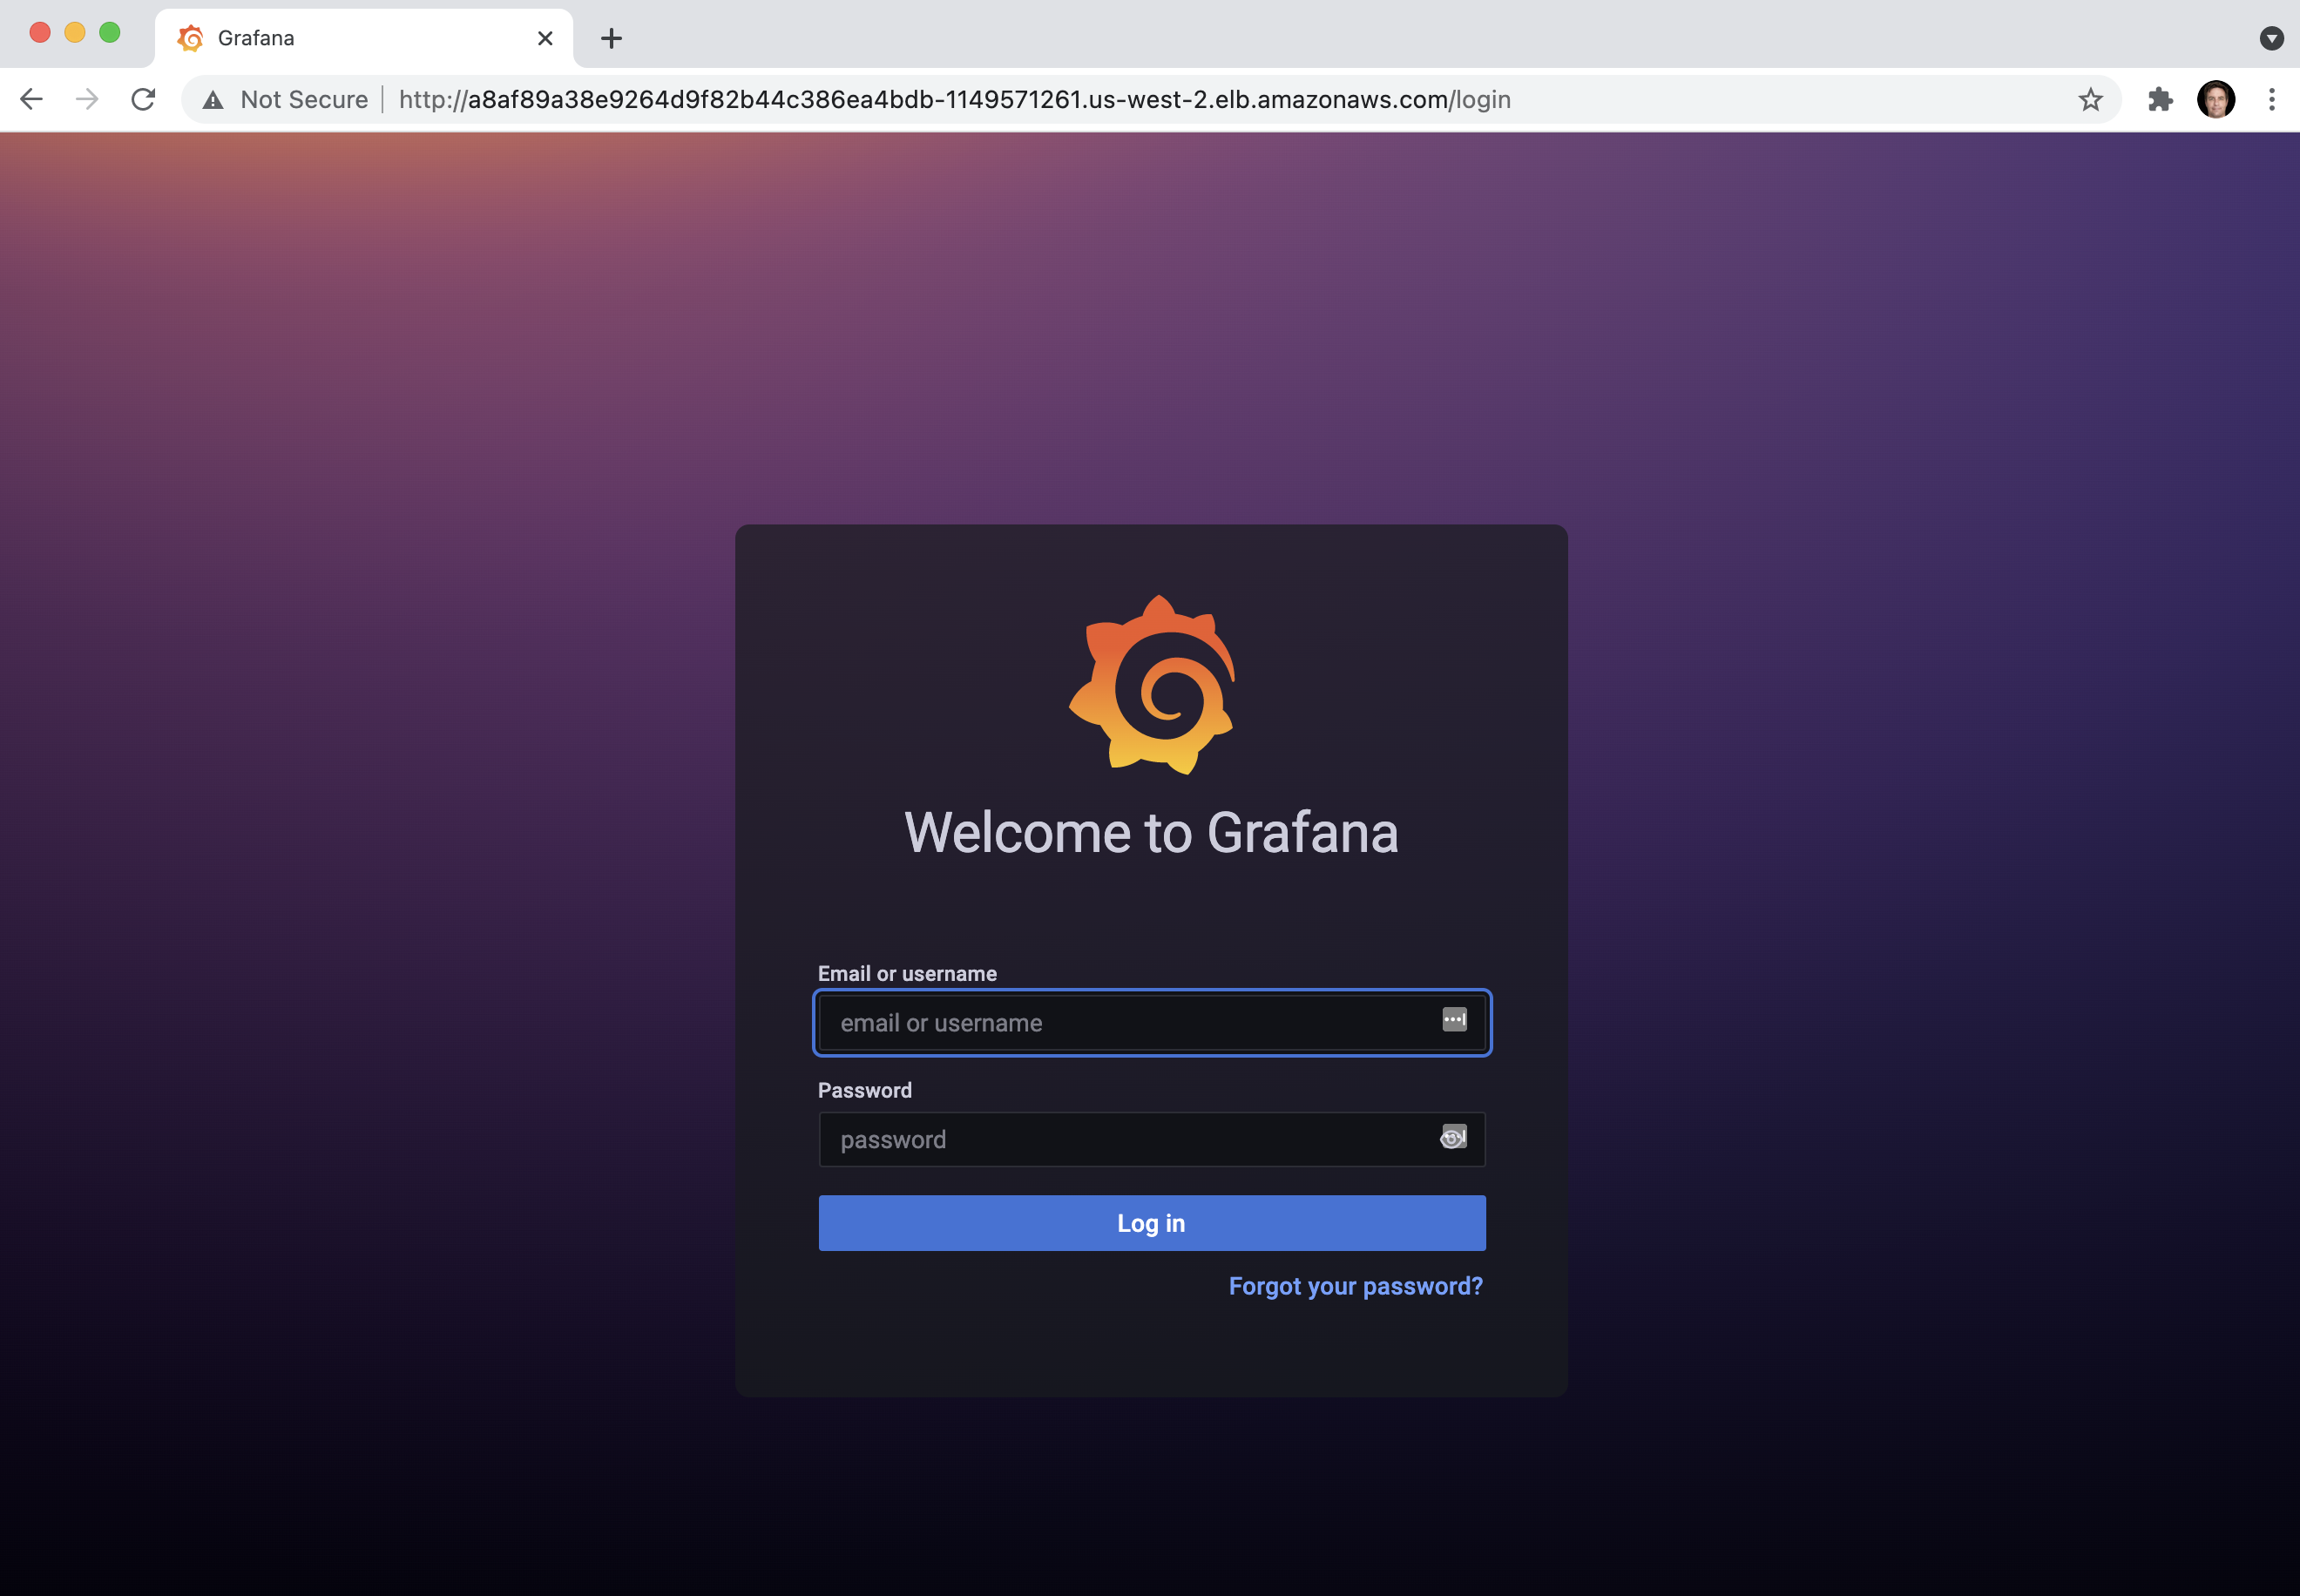
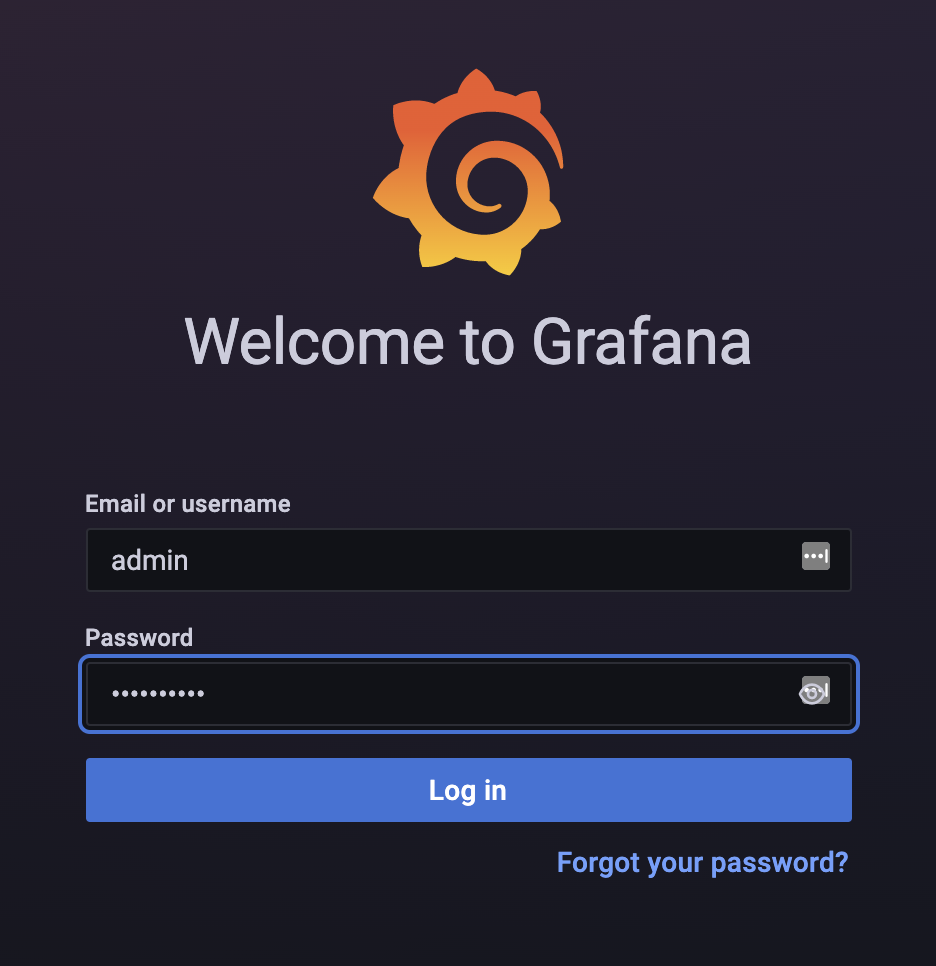
30. Login into Grafana, using the following credentials:
Email or username: admin
Password: EKS:l3t5g0
31. Once authenticated, the Welcome to Grafana home page is displayed:
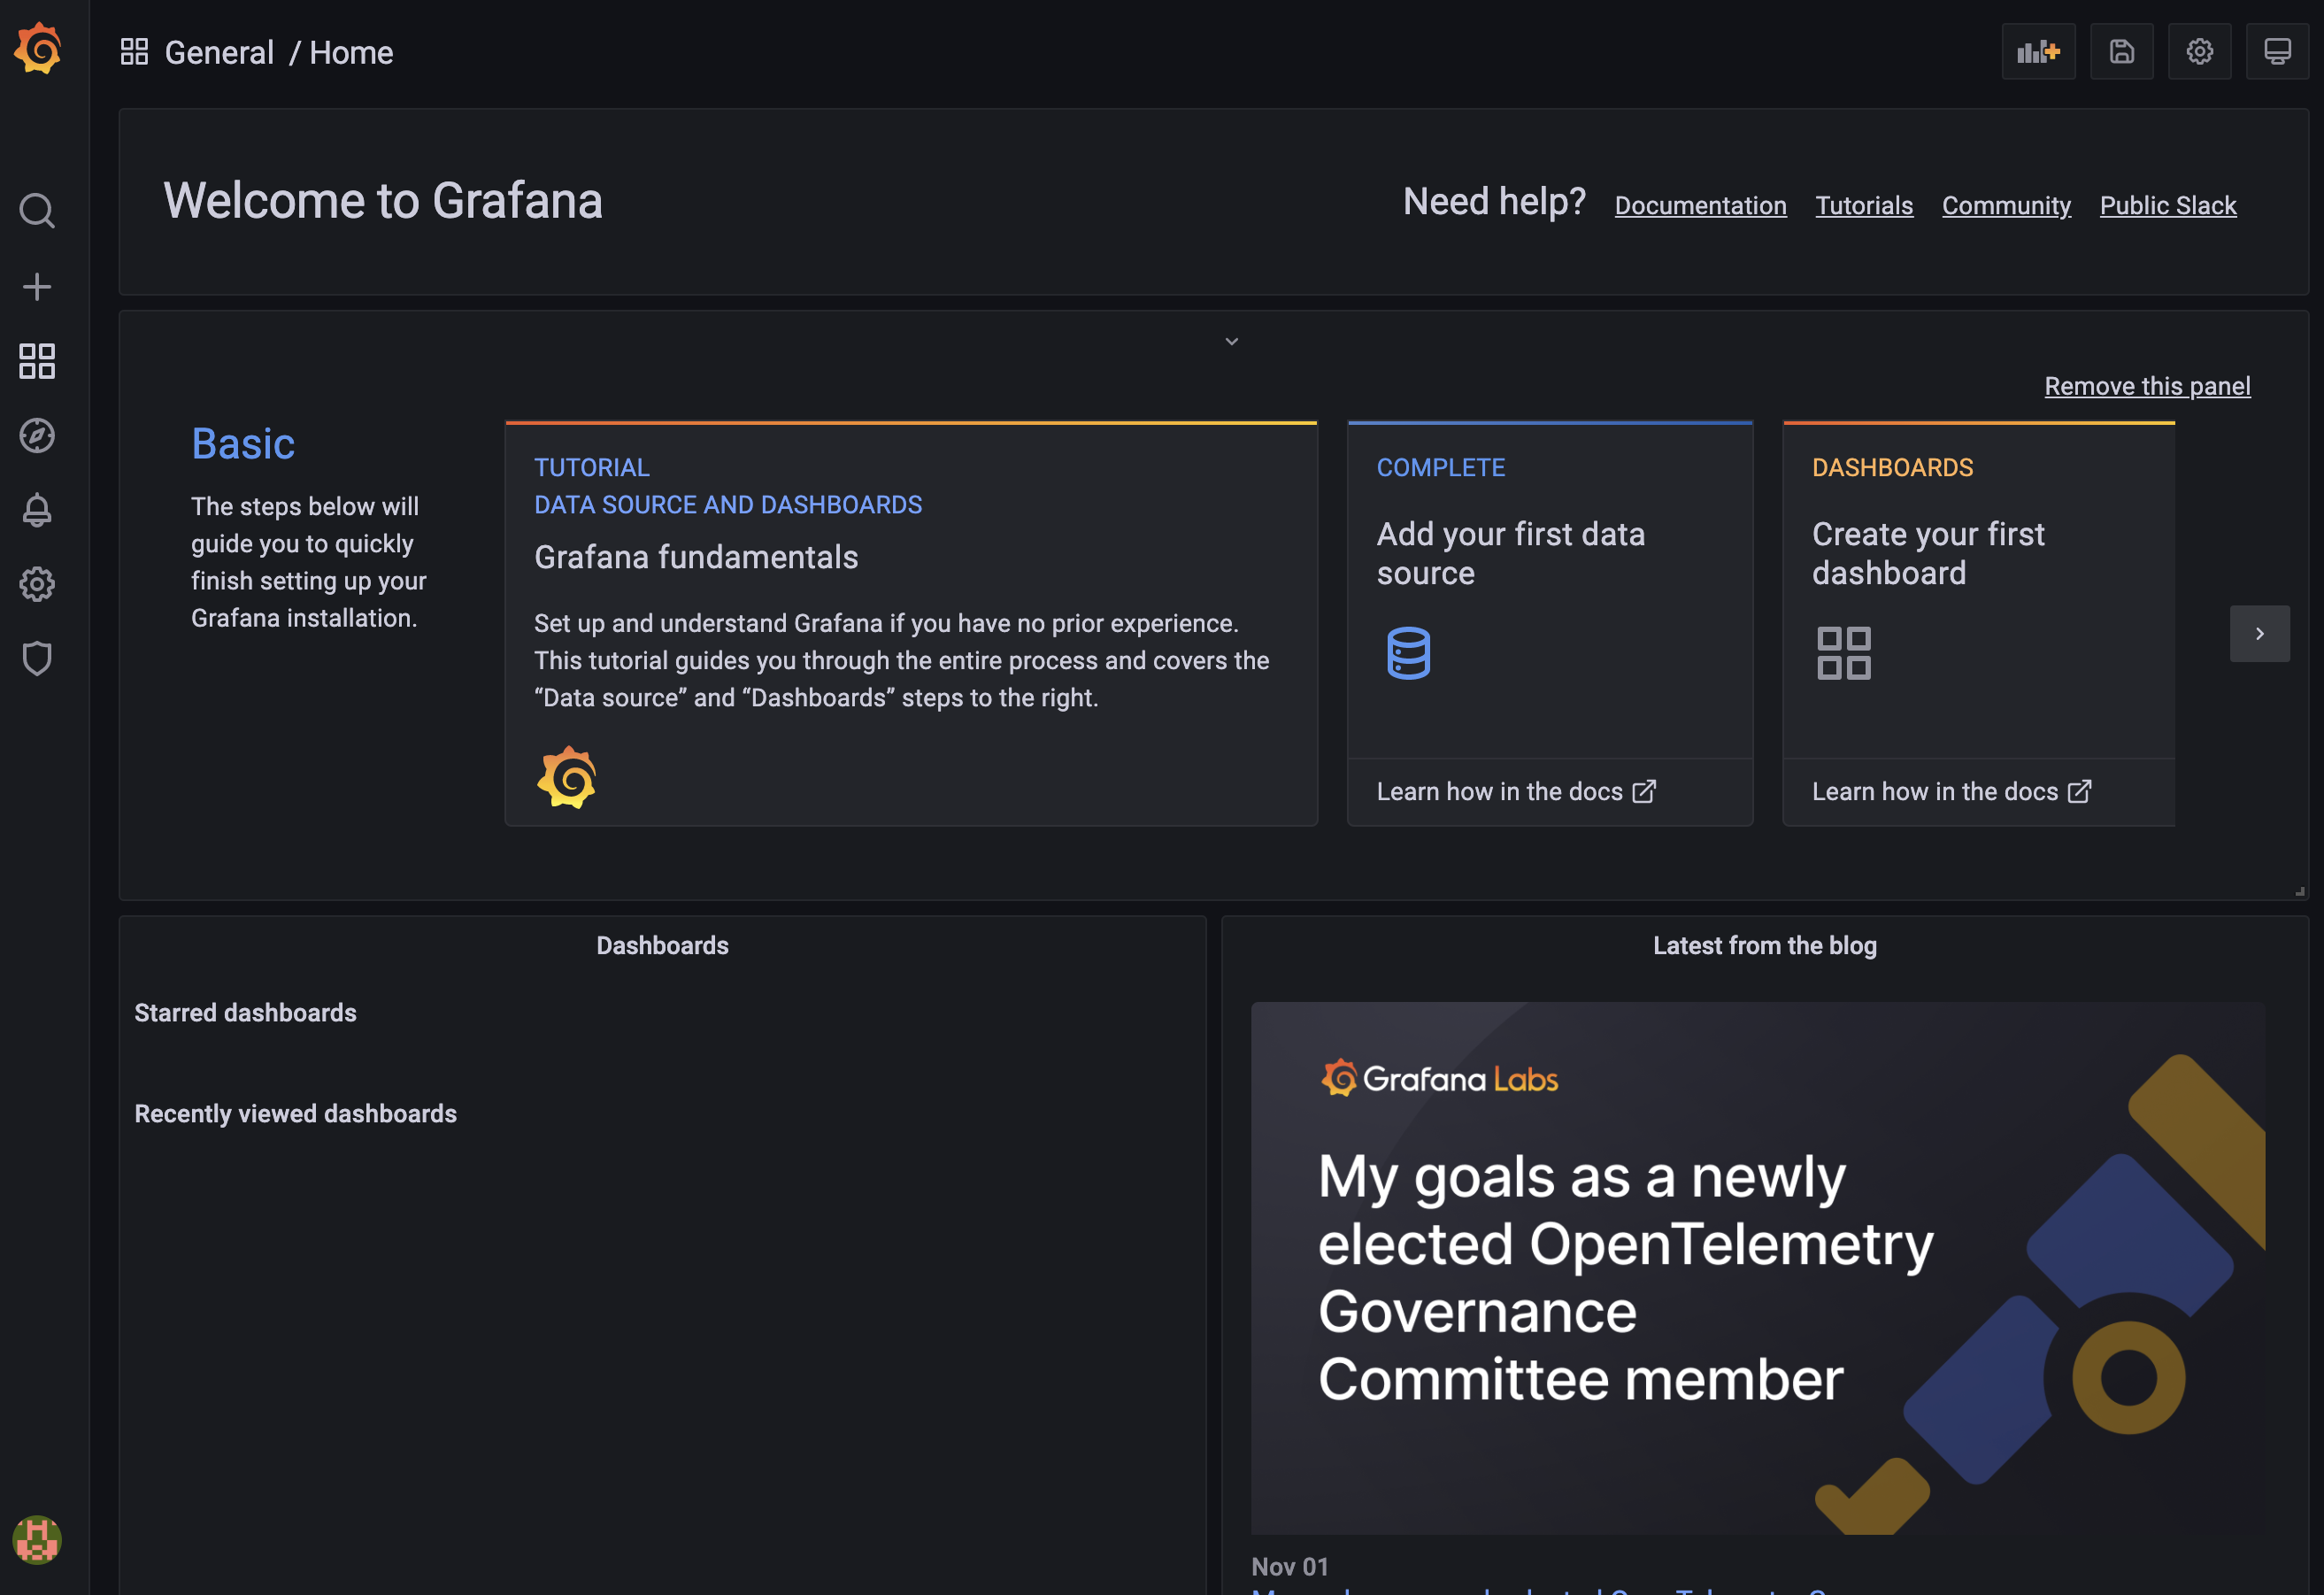
32. Click the Dashboards icon on the main left-hand side menu, and then select the dashboard Import option like so:


33. In the Import pane, enter the dashboard ID 3119 and click on the right hand side Load button:
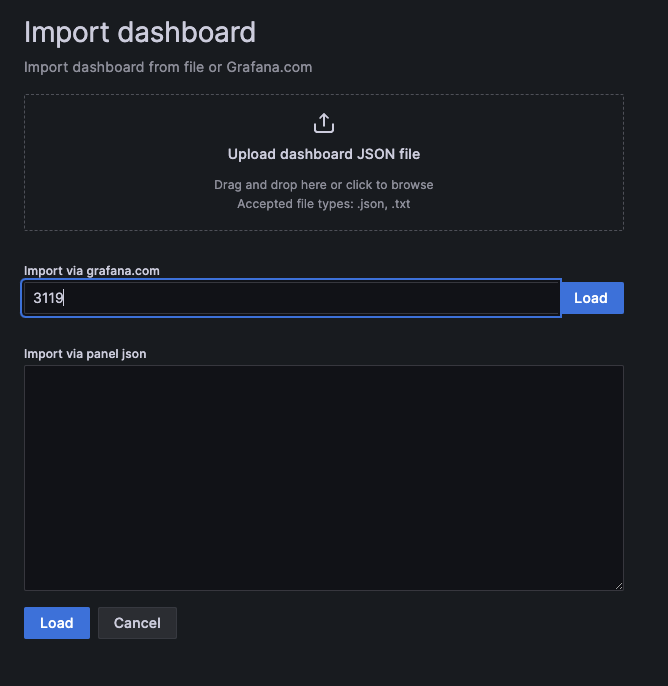
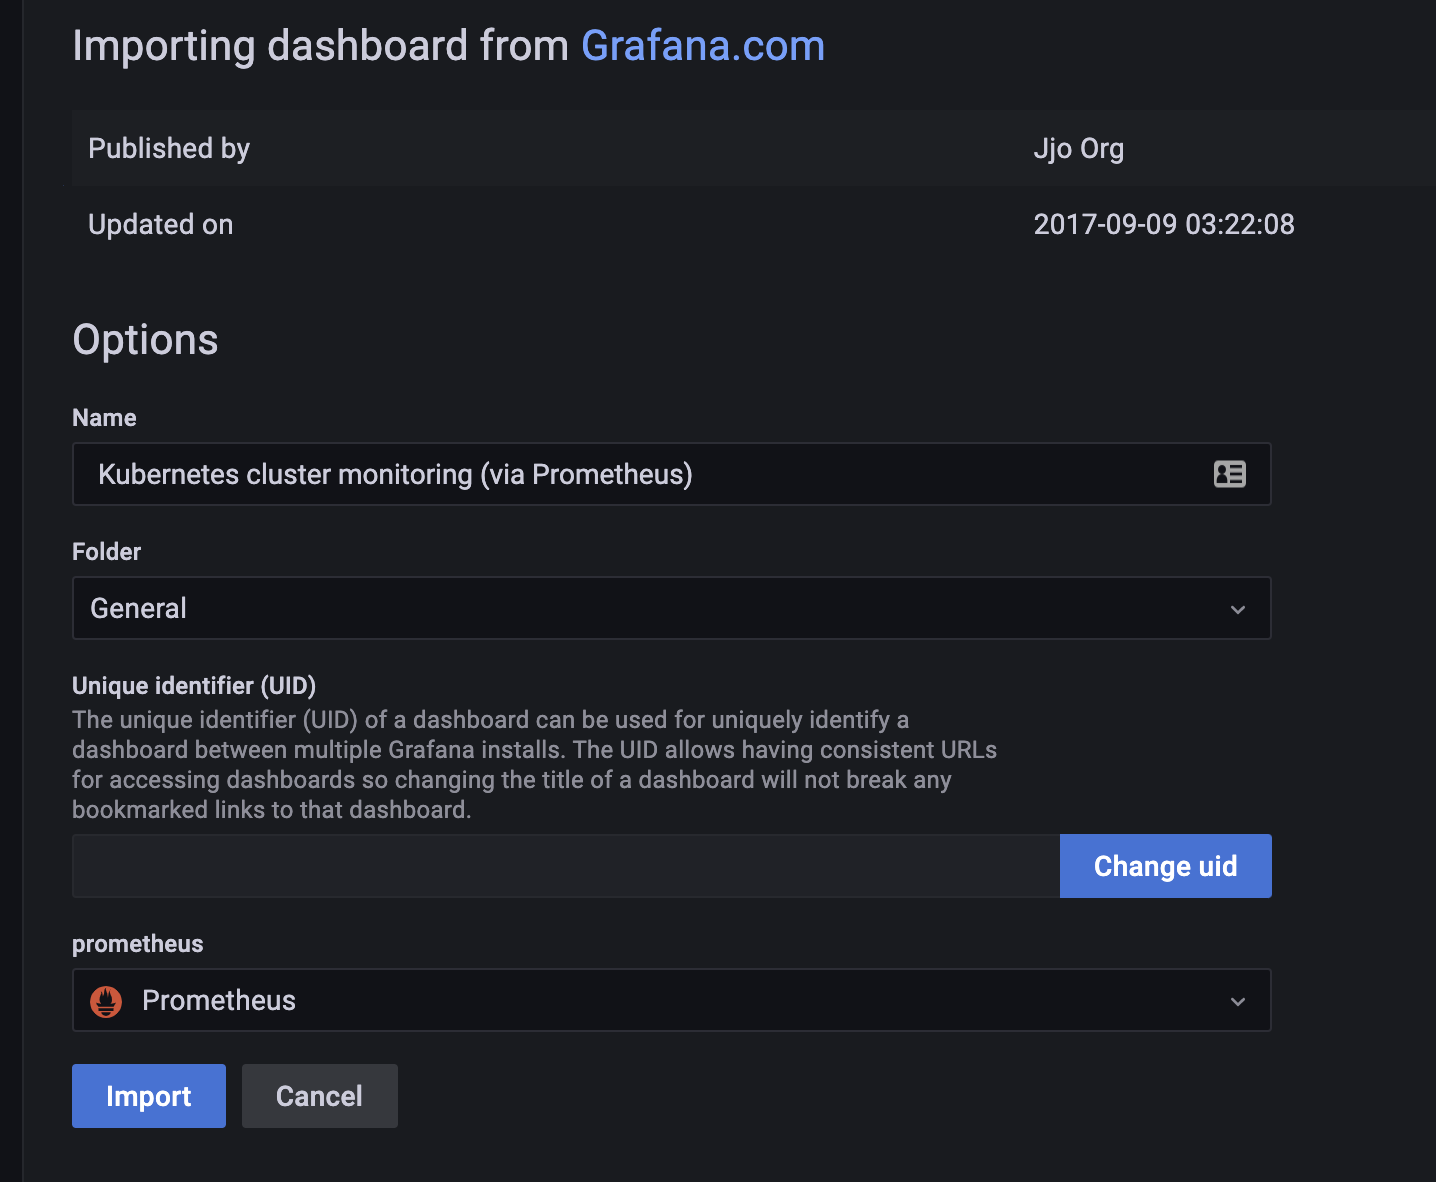
34. The Import pane now provides details for the Kubernetes cluster monitoring dashboard that you are about to install. Select and set the Prometheus datasource at the bottom of the pane, then click Import to proceed:
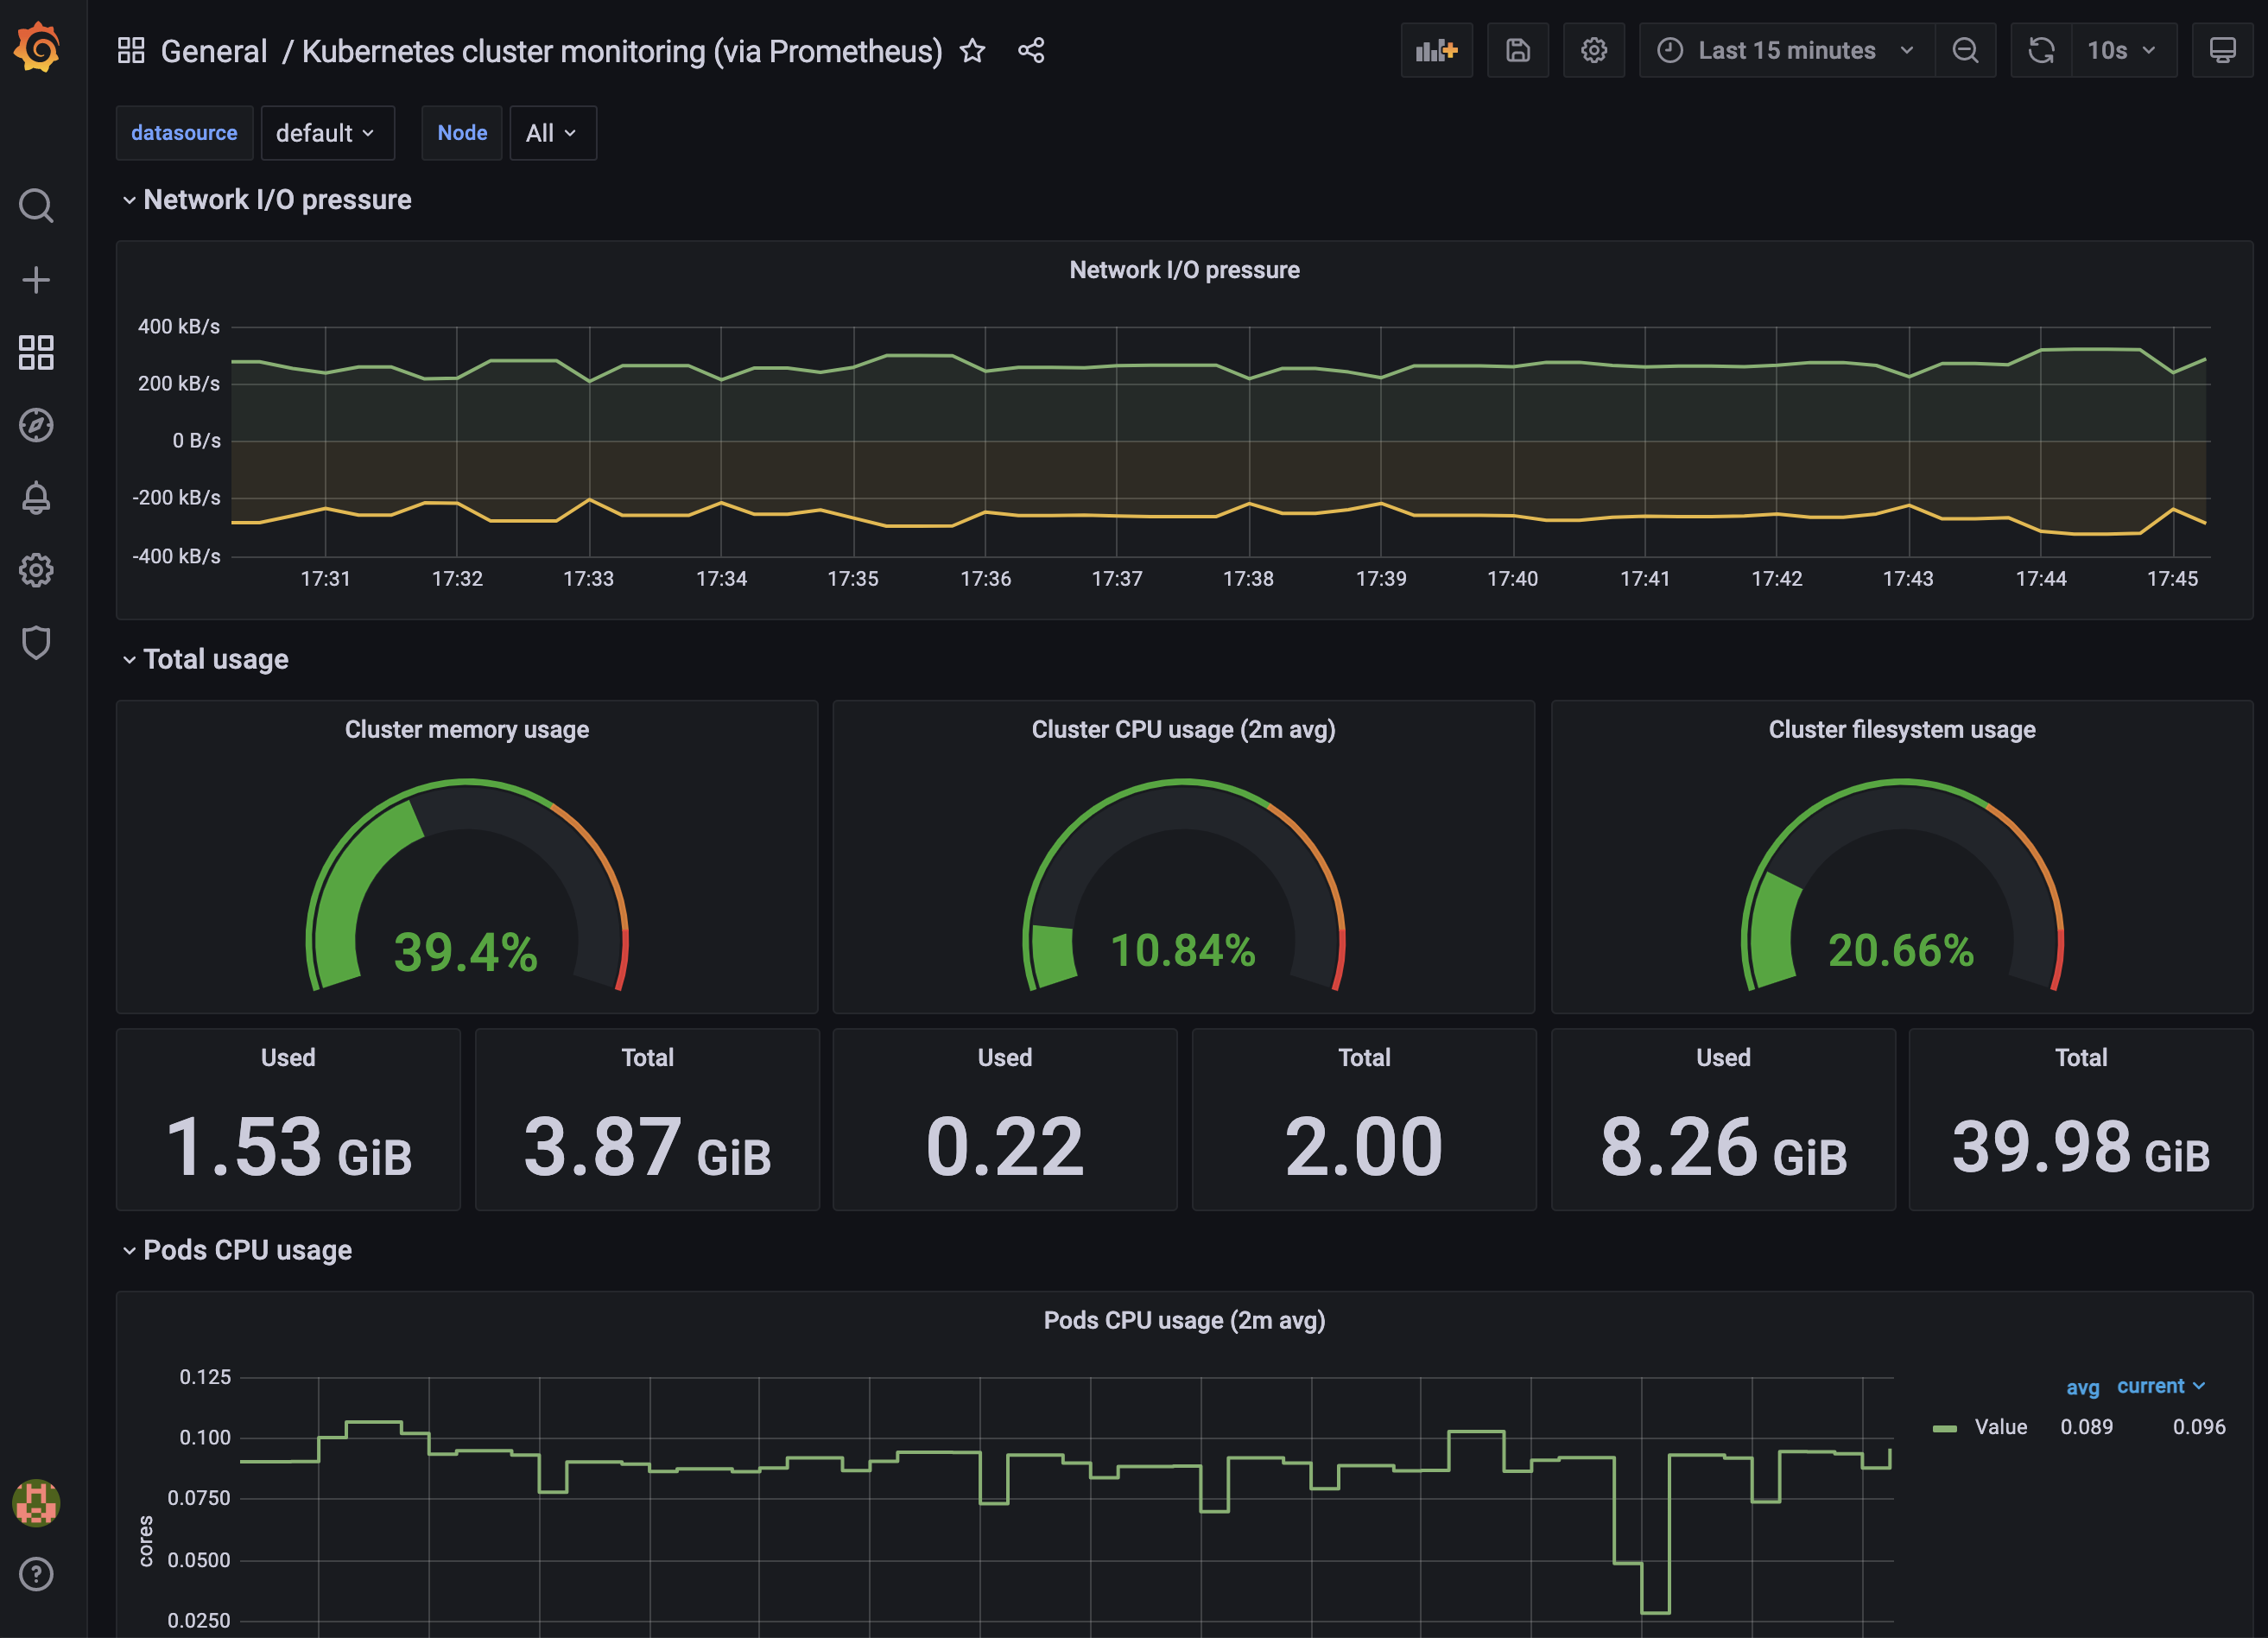
35. Grafana now loads and displays the prebuilt Kubernetes cluster monitoring dashboard and immediately renders various visualisations using live monitoring data streams taken from Prometheus. The dashboard view automatically refreshes every 10 seconds:

36. Return to the Dashboards on the main left-hand side menu, and again select the dashboard Import option like before:
37. Open a new browser tab and navigate to the following sample API monitoring dashboard URL:
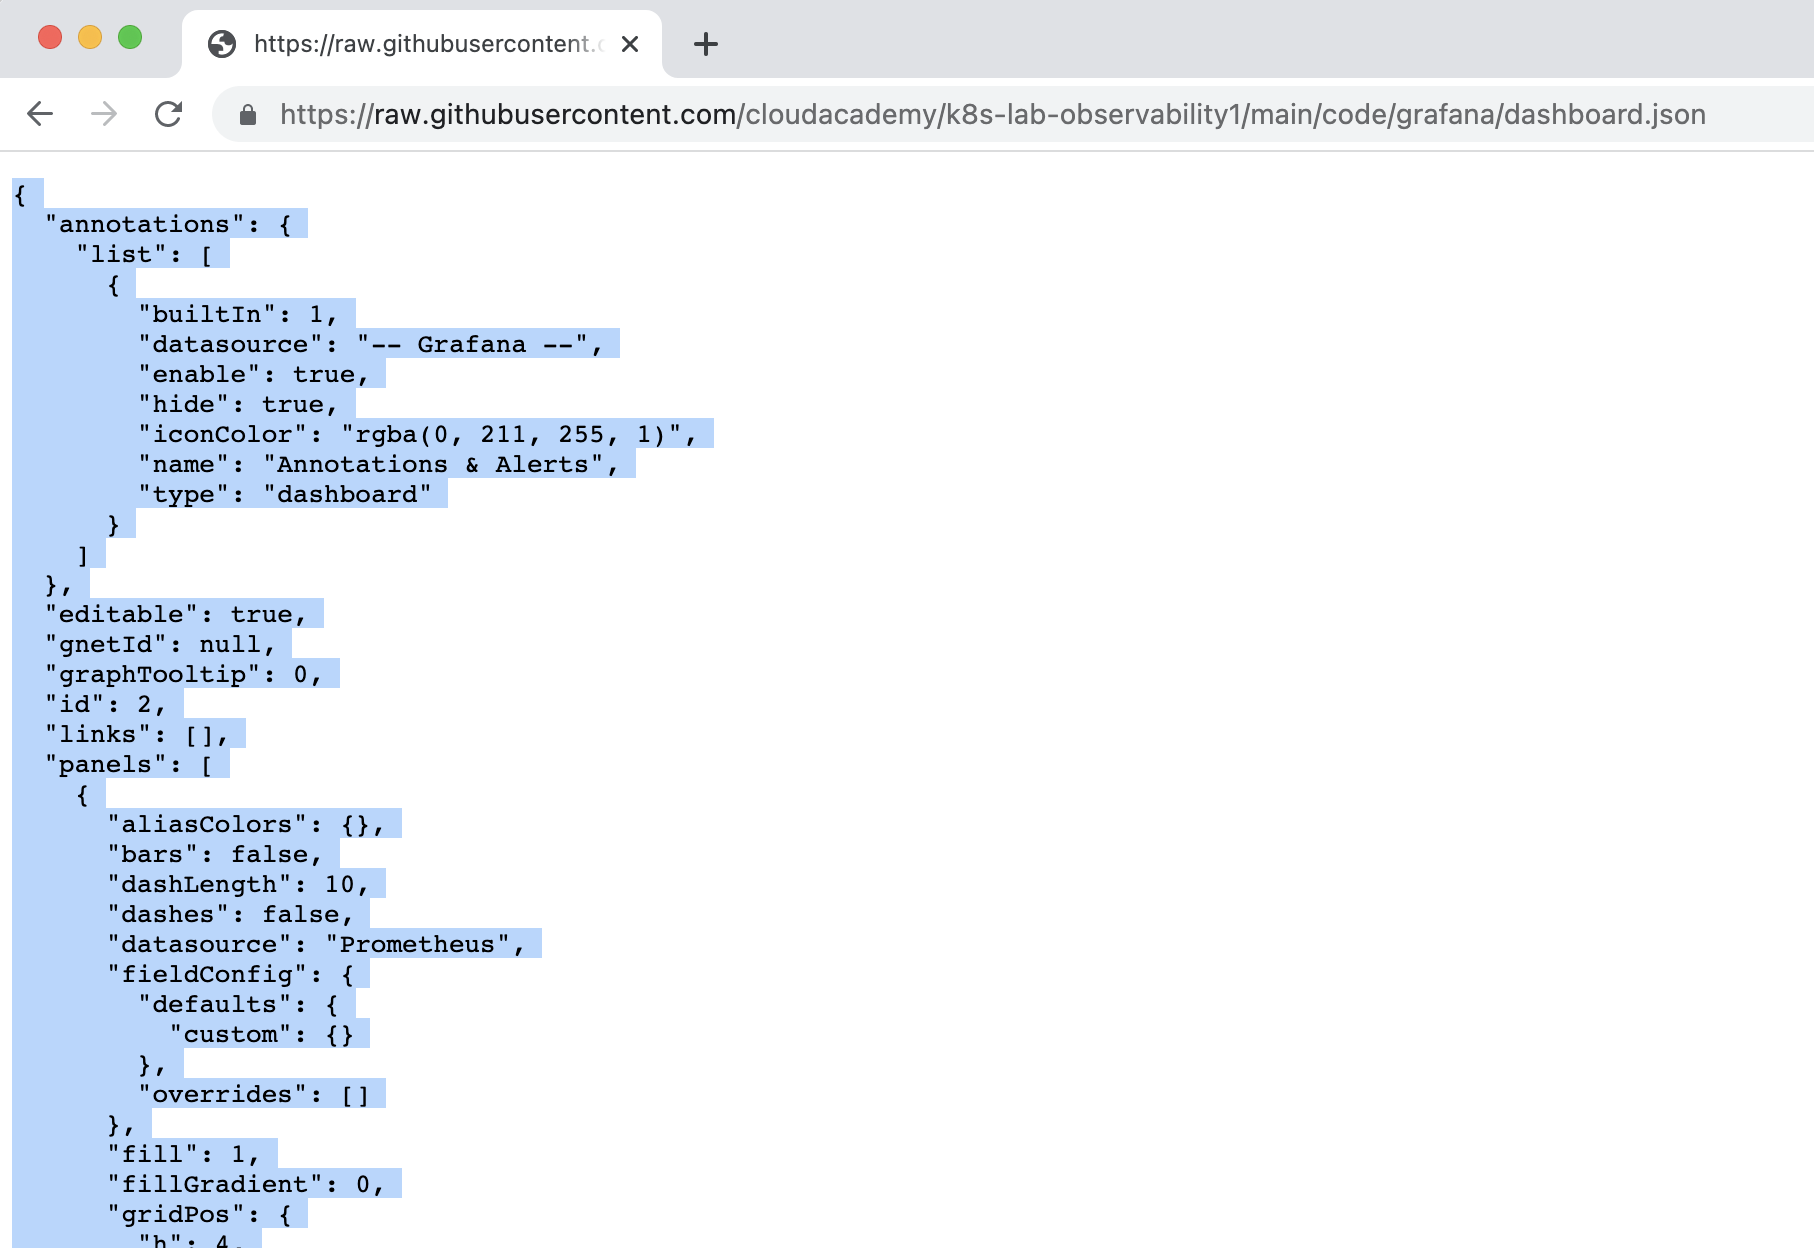
Note: The same dashboard.json file is located in the project directory (./code/grafana/dashboard.json) and can be copied directly from there if easier.
38. Copy the sample API monitoring dashboard JSON to the local clipboard:
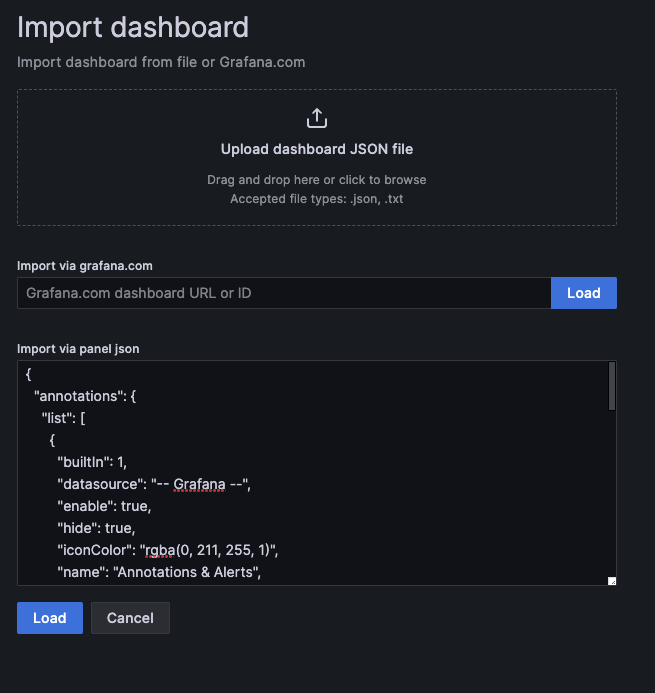
39. In the Import pane, paste the contents of the local clipboard containing the sample API monitoring dashboard configuration JSON into the Import via panel json input box. Click the bottom Load button to import the dashboard:
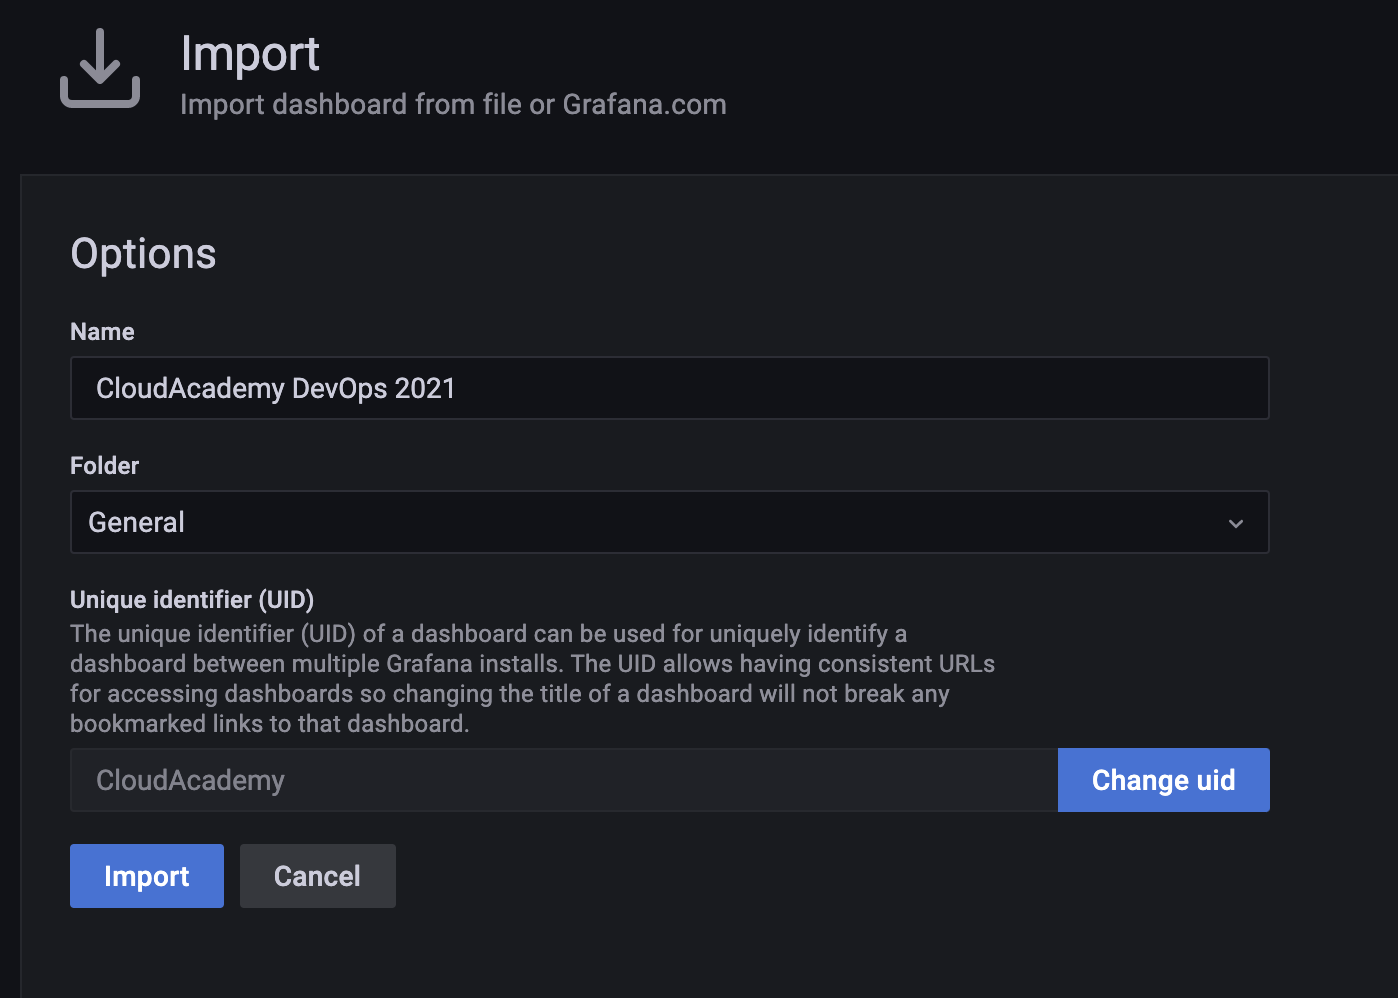
40. The Import pane now provides details for the sample API monitoring dashboard that you are about to install. Click the Import button to proceed:
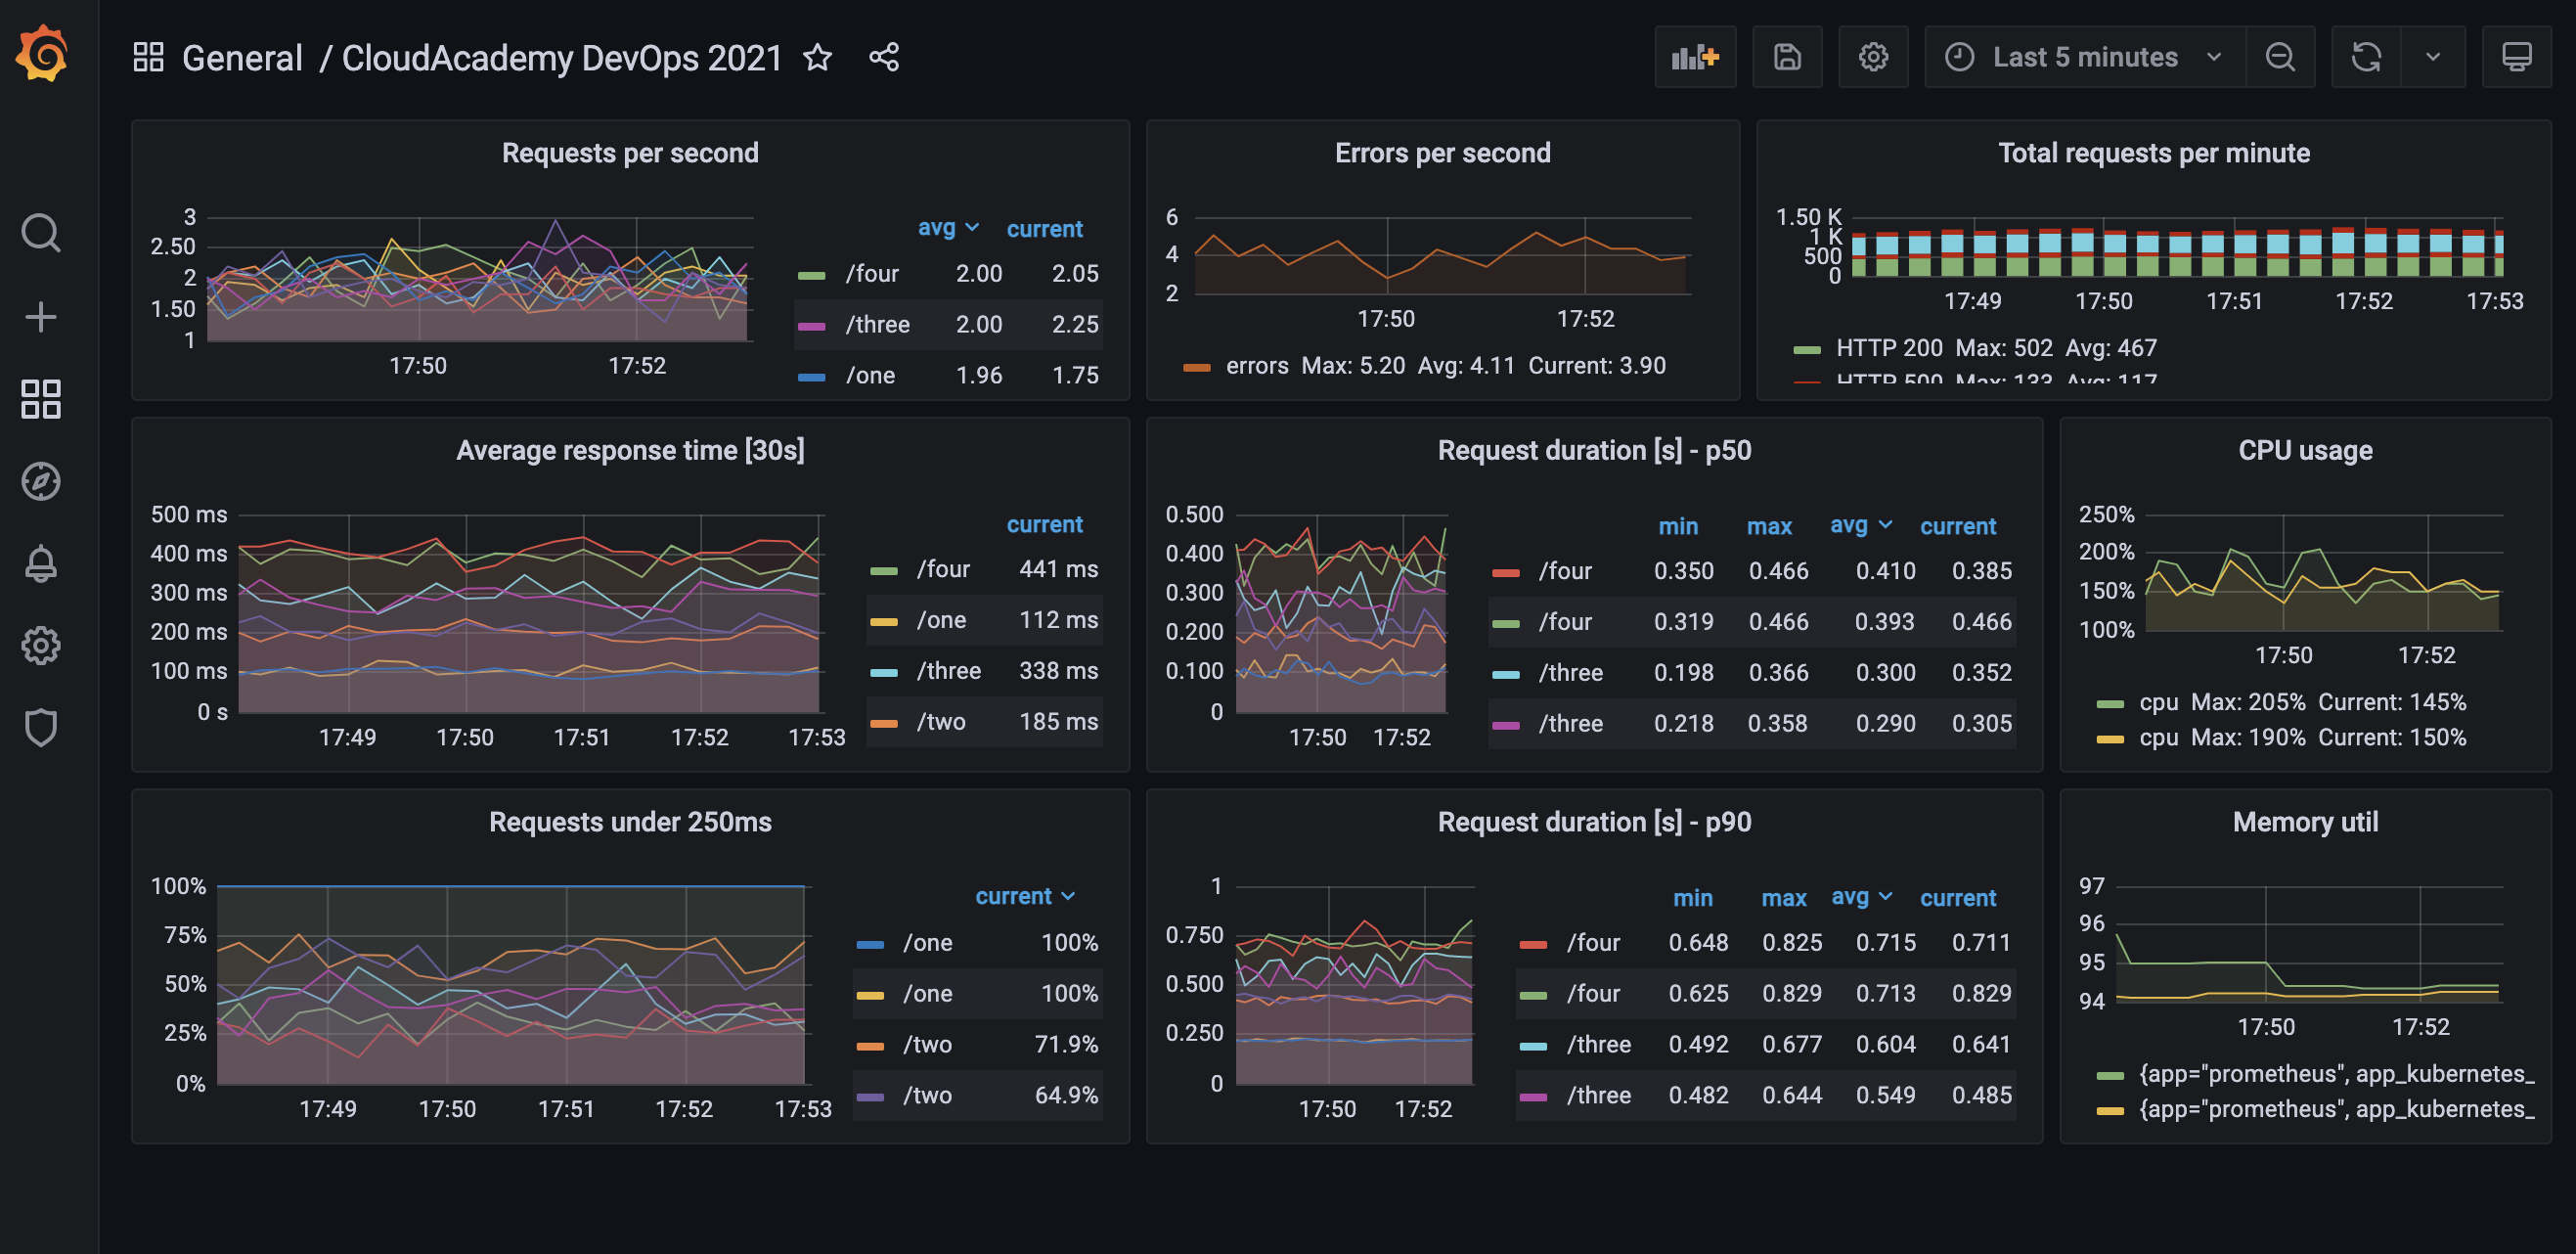
41. Grafana now loads and displays the prebuilt sample CloudAcademy DevOps 2021 API dashboard and immediately renders various visualisations using live monitoring data streams taken from Prometheus. The dashboard view automatically refreshes every 5 seconds:


Leave a Reply